From the March 2020 low, the S&P 500 rallied 63.70% in less than 6 months. This rally dwarfed my already bullish chart projection and outlook shared in the March 26 Profit Radar Report: “We anticipate a recovery towards 3,000 (for the S&P 500) over the next couple months and quite possibly new all-time highs in 2020.”
Barron's rates iSPYETF as "trader with a good track record" and Investor's Business Daily says: "When Simon says, the market listens." Find out why Barron's and IBD endorse Simon Maierhofer's Profit Radar Report
Although the March 26 Profit Radar Report outlined that new all-time highs were quite possible even in 2020, I expected a deeper pullback before actually reaching those all-time highs. Aside from a hitting a small speed bump in June, stocks never delivered such a pullback.
Throughout this rally, the S&P never dropped below key support, so reluctantly I had to allow for momentum to drive stocks higher even though stocks were over-bought and over-loved.
Fold or Stick to Your Guns?
Quite frankly, it was painful watching the market grind higher throughout August, and as an analyst I had to make a choice between:
-
Throwing all caution to the wind and buy (because it’s been working) or
-
Remaining true to historical facts and patterns.
What were the facts?
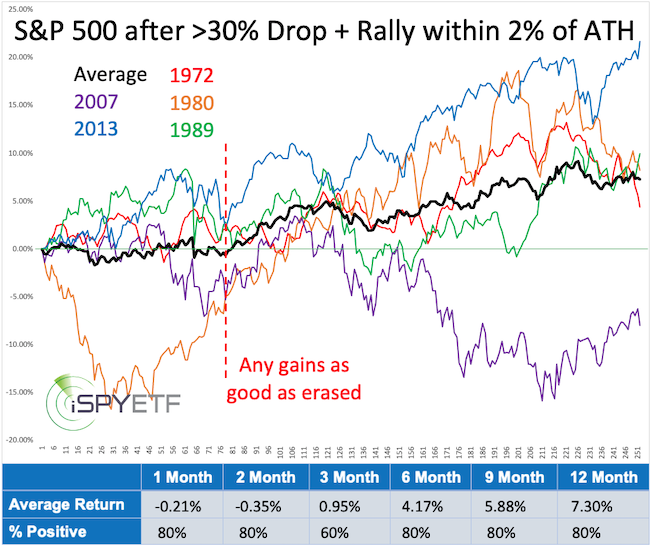
In early August, the S&P 500 came within striking distance of its February 2020 all-time high. The August 8 Profit Radar Report analyzed how the S&P 500 performed after it dropped 30% or more and subsequently rallied within 2% of an all-time high.
That forward performance was illustrated via the chart below. Forward performance was decent, but almost every time, the S&P 500 gave back all gains accrued.
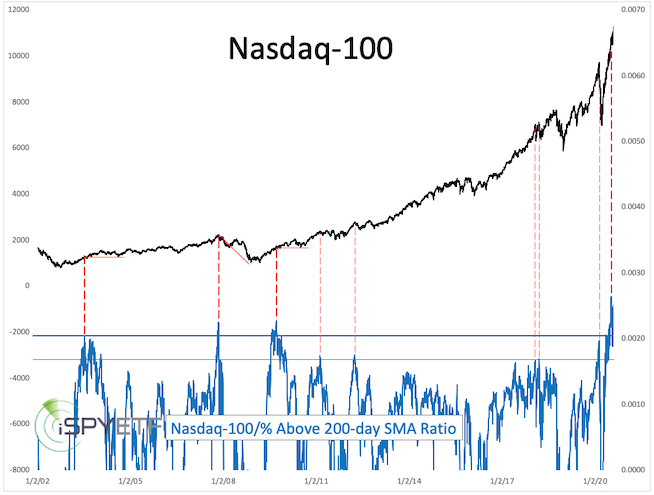
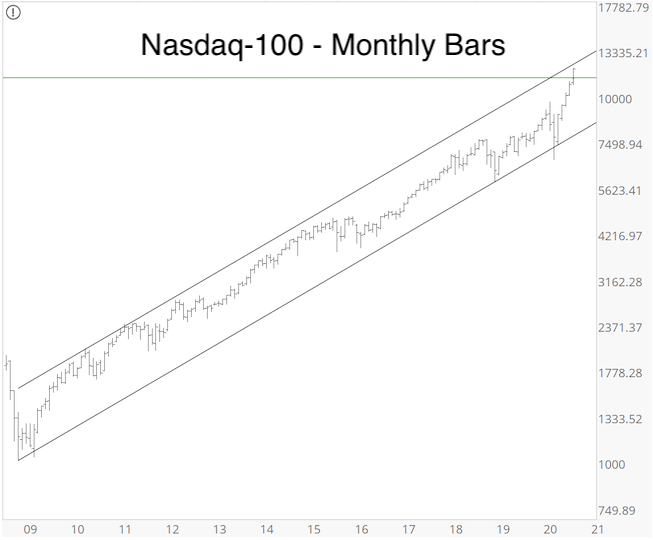
This was not the only study suggesting that any accrued gains will eventually be erased. The chart below, which plots the Nasdaq-100 against its distance from the 200-day SMA (also published in the August 9 Profit Radar Report) projected one of two possible outcomes:
-
The Nasdaq-100 will either correct fairly quickly or
-
The Nasdaq-100 will continue grinding higher but eventually give back accrued gains (horizontal red lines)
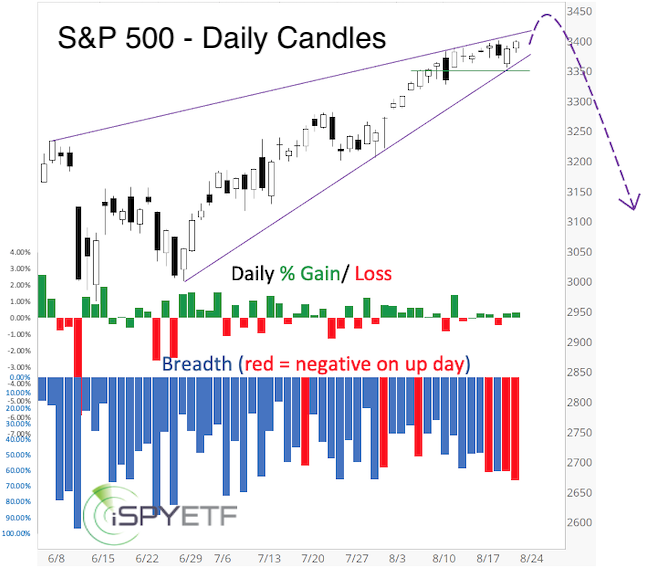
Throughout August, stocks continued higher and risk of a pullback increased. The August 23 Profit Radar Report showed that there were 6 days where the S&P closed higher, but more stocks declined than advanced. The dashed purple arrow showed the most likely price trajectory.
If you enjoy quality, hand-crafted research, sign up for the FREE iSPYETF e-newsletter & market outlook
The August 30 Profit Radar Report showed that the Nadsaq-100 almost tagged long-term trend channel resistance and warned that: “S&P 500 Futures are in nosebleed territory.” For the first time since the start of this rally I actually suggested shorting stocks as a speculative trade for aggressive investors.
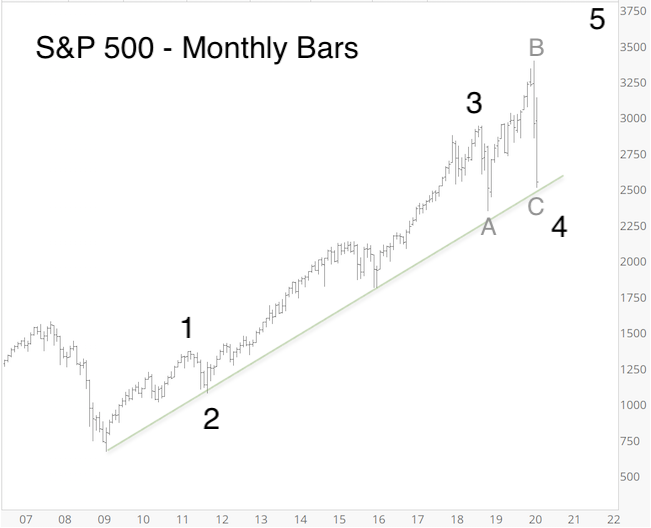
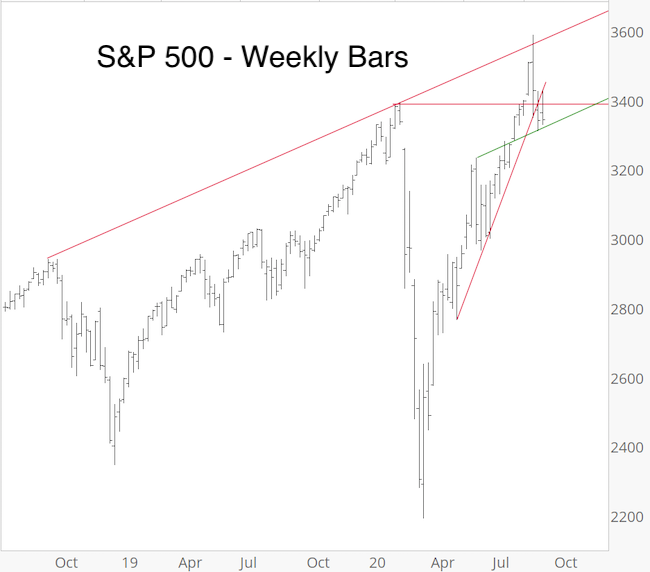
The September decline has erased all the August gains, which was the minimum expected down side. As the weekly S&P 500 chart shows, price is below double resistance, but above support. While below resistance, we need to allow for further down side, but a break below support is needed to get lower targets.
The question I keep asking myself is: How can I avoid underestimating a stock market move?
Lessons Learned
I will let you know when I’ve found a solution. For now, here are two lessons I've learned:
We are living in an age of extremes, and sometimes stocks just defy the odds
-
Don't become emotional with everyone else. The only thing worse than underestimating a trend is jumping on the trend right before it reverses.
-
One of my fellow market analyst wrote on September 2 that there is no sign of a top. Over the next 3 days the Nasdaq-100 lost some 10%. Investing peer pressure is powerful and as it becomes more intense it becomes more dangerous.
Continued updates are available via the Profit Radar Report.
Simon Maierhofer is the founder of iSPYETF and the publisher of the Profit Radar Report. Barron's rated iSPYETF as a "trader with a good track record" (click here for Barron's evaluation of the Profit Radar Report). The Profit Radar Report presents complex market analysis (S&P 500, Dow Jones, gold, silver, euro and bonds) in an easy format. Technical analysis, sentiment indicators, seasonal patterns and common sense are all wrapped up into two or more easy-to-read weekly updates. All Profit Radar Report recommendations resulted in a 59.51% net gain in 2013, 17.59% in 2014, 24.52% in 2015, 52.26% in 2016, and 23.39% in 2017.
|