Subscribers to iSPYETF’s free e-mail newsletter receive a market outlook, usually once a week. The market outlook below was sent out on March 3, 2022. If you’d like to sign up for the free e-newsletter, you may do so here (we will never share your e-mail with anyone, just as we don't accept advertising).
Last week we looked at the S&P 500 diagonal. This diagonal pattern has kept us on the right path for several weeks and has provided a down side target which has not yet been reached.
This week we’ll look at more traditional technical analysis.
1) The S&P 500 tagged support around 4,1130 and closed the open chart gap at 4,116.93
2) There was a bullish RSI-35 divergence at the February 23 closing low
3) The S&P 500 is now back a black trend channel resistance
4) The S&P 500 is above the first diagonal resistance line
5) The S&P 500 is about in the middle of the recent trading range
6) There is another open chart gap (and support) at 4,020.63
… And there is war in the Ukraine, inflation, and a pandemic
What does all this mean?
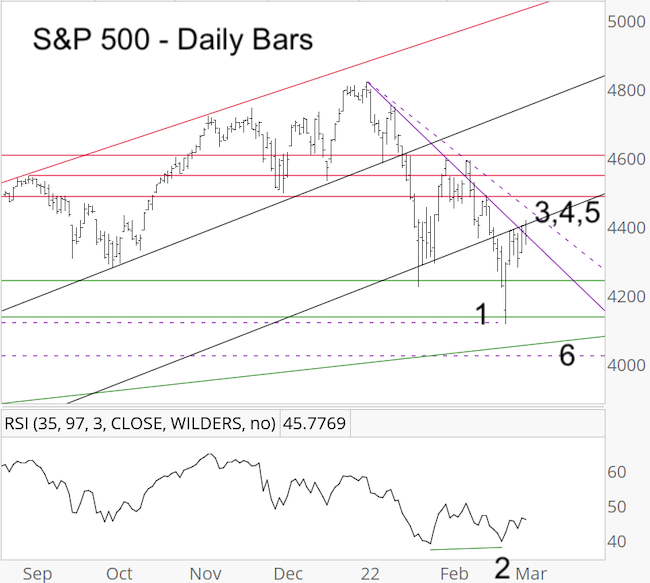
Thus far the S&P bounced from support and is now butting up against initial resistance, nothing unusual. However, price is getting close to invalidating the diagonal (I drew two potential diagonal resistance line, one solid and one dashed, both in purple and descending). The RSI divergence could mean a low (of some sort) is already in.
In other words, all the technical analysis in the world does not provide a big edge at this time. This is not unexpected. I warned in the Profit Radar Report that we are about to enter such a time:
“Last week’s (S&P 500) price overlap eliminated one clear Elliott Wave Theory pattern. We are left with either:
- A messy pattern
- A mid-term bullish pattern which would soon project another pullback
- A bearish pattern which would project a sizable bounce
Regardless of which path the market chooses, choppiness appears to be ahead. A decline should be followed by a bounce and a rally would likely to be followed by a pullback.”
I don’t pretend to know when I don’t, but knowing when to expect an untradeable environment is also helpful (unless you enjoy getting whip-sawed).
Based on the diagonal pattern, I’ve been looking for overall lower prices for about the past month. This pattern is not yet dead, but it’s getting stretched.
Although it’s difficult to find a low-risk entry at this time, the most promising approach looks to buy if and once we see new lows.
Whether the ensuing bounce will challenge or surpass the prior all-time highs is not clear, but it should be tradeable.
On that note, crowd psychology is providing very interesting feedback.
At least once a month, the Profit Radar Report provides an in depth look at investor sentiment. Here is what was published on February 27:
The first chart plots the S&P 500 against 9 different sentiment gauges. At first glance this chart probably doesn’t tell you much.
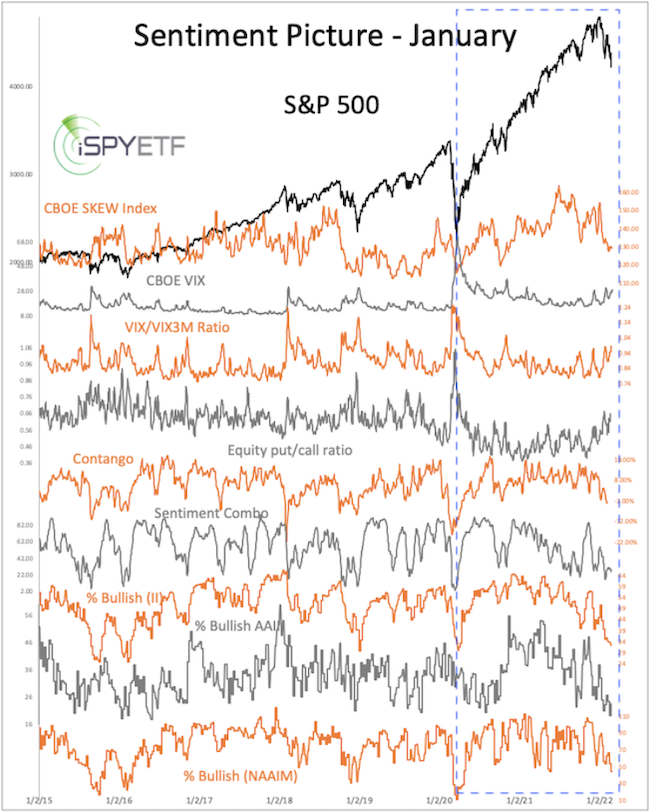
That’s why I take it a step further. That step is to identify other times with the most similar sentiment readings.
How do I quantify ‘most similar’?
Most similar means when at least 6 (of the 9) sentiment gauges fall within a 10% range of current readings. And that’s where it gets interesting.
The next chart shows that there were 7 signal dates where at least 6 of 9 indicators are within a 10% range. All of them occurred near significant lows (2015, 2016) or after a low was carved out (2020).
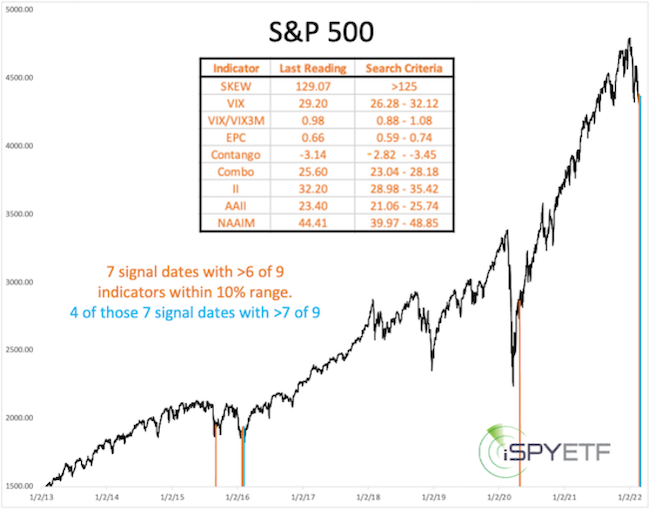
The sample size is small, but its curiously unanimous.
Regular readers of the Profit Radar Report know that I apply the same approach to identifying precedents to market breadth, volatility, most closely correlated price patterns, etc.
The result is not always as clear (or small), but it gives us an idea of how markets have reacted in the past under similar circumstances (which obviously don’t include Russia, inflation or a pandemic), but it’s still the best we can do.
Continuous updates and factual out-of-the-box analysis is available via the Profit Radar Report.
The Profit Radar Report comes with a 30-day money back guarantee, but fair warning: 90% of users stay on beyond 30 days.
Barron's rates iSPYETF a "trader with a good track record," and Investor's Business Daily writes "Simon says and the market is playing along."
|
