Subscribers to iSPYETF’s free e-mail newsletter receive a market outlook, usually once a week. The market outlook below was sent out on April 28, 2022. If you’d like to sign up for the free e-newsletter, you may do so here (we will never share your e-mail with anyone, just as we don't accept advertising).
The last Market Outlook e-mail from April 14 featured the chart below. It highlighted the 'where the rubber meets the road' zone (red box) and a bearish overlap (red line).
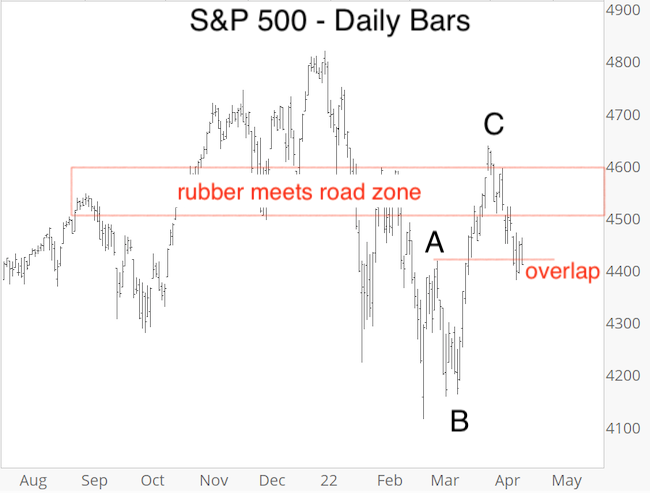
The red line overlap eliminated the most straight-forward bullish pattern (5-wave advance according to Elliott Wave Theory).
With the most straight-forward bullish path off the table, the April 13 Profit Radar Report outlined the next two most likely options:
"1) The correction from the January high is turning more complex (larger scale wave 4) with continued choppiness but not massive losses (test or break of February low possible).
2) Stocks will roll over and head significantly lower.
Option 1 still has the better odds, but option 2 gained ground since the S&P dropped below 4,416.78.
Due to the open chart gaps stocks are likely to come back up and close them (eventually), but the S&P could fall towards and even below 4,000 before giving away whether option 1 or 2 (or something else is playing out)."
Market breadth has been less than thrilling. The chart below identifies other times breadth was similar to last Friday's reading while the S&P 500 was more than 10% from its all-time high (see chart insert for exact criteria).
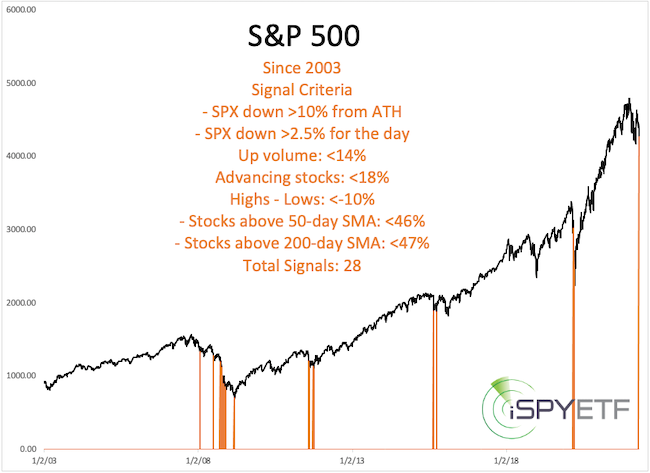
Similar readings usually led to a bounce (2012, 2015) or bust (2008, 2020).
I know, 50/50 bounce or bust odds don't give much of an edge, but there's no sense shooting the messenger, stats are what they are.
I could make up tantalizing, sensationalistic headlines - like so many do - but you read these pages for fact-based information, not entertainment or excitement.
While I'm aware of the danger and S&P 4,000 has become quite possible, I have not yet turned uber-bearish (beyond 4,000).
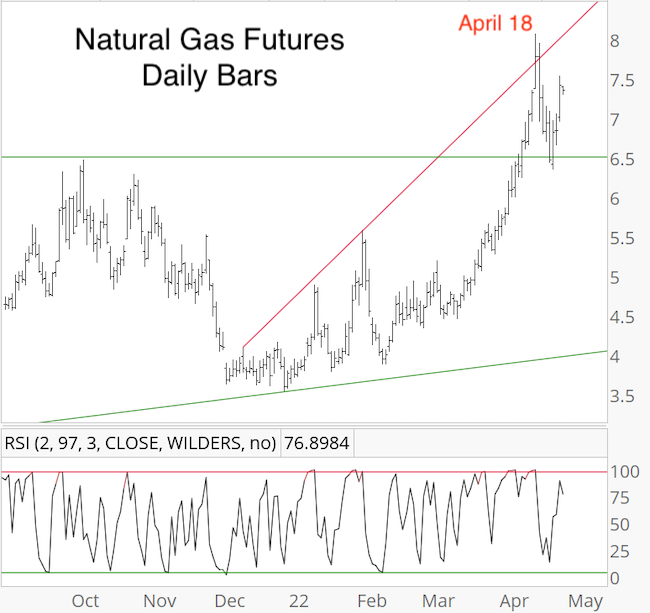
Natural gas has been on fire. but I warned in the April 20 Profit Radar Report of the following:
"Natural gas has been on our buy list for quite a while, but never pulled back into our buy zone. Gas soared 63% just over the last month and such gains are simply unsustainable. Although there’s a solid fundamental rationale behind rising gas prices, it’s gotten to a point where a violent (possibly only brief) pullback can (and should) happen at any time. Aggressive investors may take a stab at shorting gas for a quick trade now or if trend line resistance is tagged."
As the chart shows, natural gas fell 21% in 5 days, found support and bounced right back. As long as support holds, price can continue higher.
There are huge moves everywhere. The Profit Radar Report doesn't cover every asset class, but the information provided is a shot of sane analysis in an insane market.
Objective, comprehensive, fact-based research void of emotions and biases. If that's the kind of analysis you're looking for to guide you through challenging times, sign up for the Profit Radar Report.
The Profit Radar Report comes with a 30-day money back guarantee, but fair warning: 90% of users stay on beyond 30 days.
Barron's rates iSPYETF a "trader with a good track record," and Investor's Business Daily writes "Simon says and the market is playing along."
|
