Subscribers to iSPYETF’s free e-mail newsletter receive a market outlook, usually once a week. The market outlook below was sent out on June 16, 2022. If you’d like to sign up for the free e-newsletter, you may do so here (we will never share your e-mail with anyone, just as we don't accept advertising).
Since last week's PRR we've seen some heavy, heavy losses ... and Simon eat humble pie. Yes, the weight of evidence suggested a stronger bounce in May/June ... but the bounce failed in a big way.
I wrote the following in the May 22 Profit Radar Report:
"We've sliced, diced and analyzed breadth, price and sentiment data all different kind of ways in recent weeks. The resulting studies usually yielded similar lessons:
- Stocks are over-sold and over-hated enough to cause a bounce (even during bear market environments)
- If stocks don't bounce, there's risk of a meltdown (the meltdown odds were previously pegged at around 20%)"
Stocks soared the following 3 days, but ultimately the bounce rolled over after just 10 trading days, which is historically highly unusual.
But, as stated in the June 1 Profit Radar Report, we knew that: "A break below 3,918, and especially 3,810 would put bears back into the drivers seat and increase the odds of a rather nasty decline."
The Thursday, Friday, Monday selling frenzy saw 83.31%, 84.16%, 94.54% of NYSE-traded stock decline on 93.47%, 89.22%, 96.36% of volume.
The 3-day average of declining stocks and volume was 12.67% and 6.31%. There've only been 7 worse 3-day spells (or spills) since 1970, which are highlighted below:
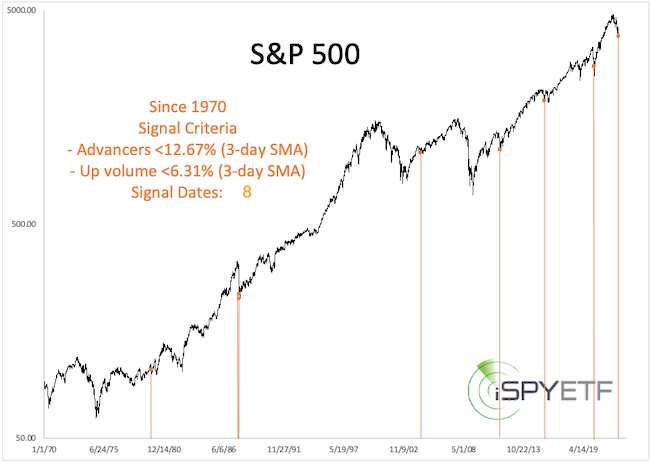
The highlighted signal dates don't look long-term bearish.
The latest meltdown happened just a few days after a solid breadth thrust with a 3-day average of 82.44% of stocks advancing on 84.88% of volume.
This sequence of buying thrust followed by selling frenzy (to that extent) is historically unprecedented, which explains why I favored the bounce to continue.
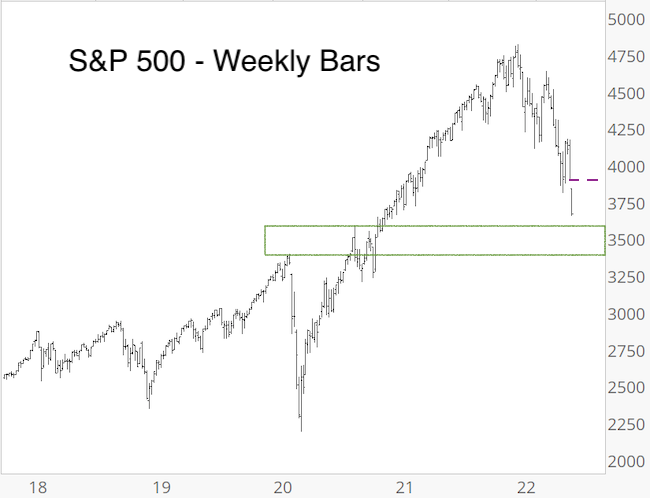
But sometimes the stock market just goes against all odds. The weekly S&P 500 chart shows two important things to consider:
- There's a massive chart gap at 3,900, which certainly will be closed.
- There's support at 3,600 - 3,300, which could be tested.
There's panic and blood on Wall Street. During normal times, this is about the time to be rational and go against the trend. The question is: Are these normal times?
The rally from the March 2020 low to the January 2022 high was everything but normal and extended further than it should have. We could now see the opposite effect.
Continued updates and comprehensive, fact-based, out-of-the box analysis is available via the
Continued updates and factual out-of-the box analysis are available via the Profit Radar Report.
The Profit Radar Report comes with a 30-day money back guarantee, but fair warning: 90% of users stay on beyond 30 days.
Barron's rates iSPYETF a "trader with a good track record," and Investor's Business Daily writes "Simon says and the market is playing along."
|
