Despite a dismal second half, gold finished 2016 up 8.7% gain, the biggest annual gain since 2011.
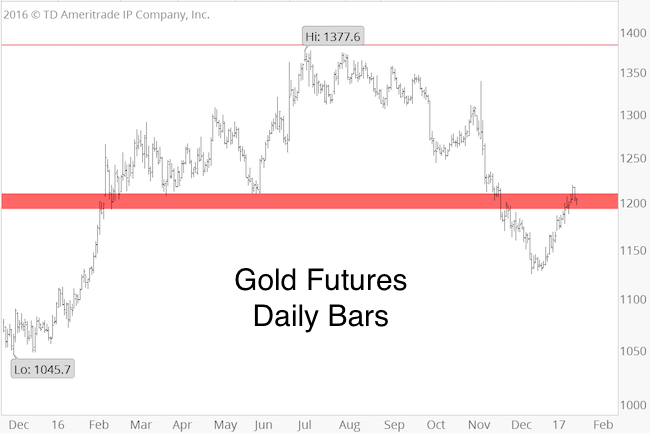
The chart below shows gold’s performance since the December 2, 2015 low at 1,045.70. From there we’ll ascertain what’s ahead for 2017.
Below $1,000/oz?
In late 2015, gold analysts expected price to drop below 1,000:
-
CNBC: “Unable to get a bid, gold is going to $900” – December 4, 2015
-
Reuters: “Gold traders raise bets prices will soon drop to $1,000” – December 8, 2015
The November 15, 2015 Profit Radar Report stated that: “A move towards 1,050 is still possibly, but the mid-term up side potential outweighs the short-term down side risk.”
Barron's rates iSPYETF as "trader with a good track record" and Investor's Bussines Daily says "When Simon says, the market listens." Find out why Barron's and IBD endorse Simon Maierhofer's Profit Radar Report.
The December 2 Profit Radar Report observed that: “Gold futures fell to a new low today. There are three different bullish RSI divergences. The odds of a bounce seem to increase with every tic lower.”
If you enjoy quality, hand-crafted research, >> Sign up for the FREE iSPYETF Newsletter
Gold prices raced higher the first half of 2016.
By July 6, 2016, gold traded as high as 1,377.6, up as much as 32.74%.
The July 7, 2016 Profit Radar Report stated that gold almost reached the minimum up side target (see chart below) and warned of a pullback.
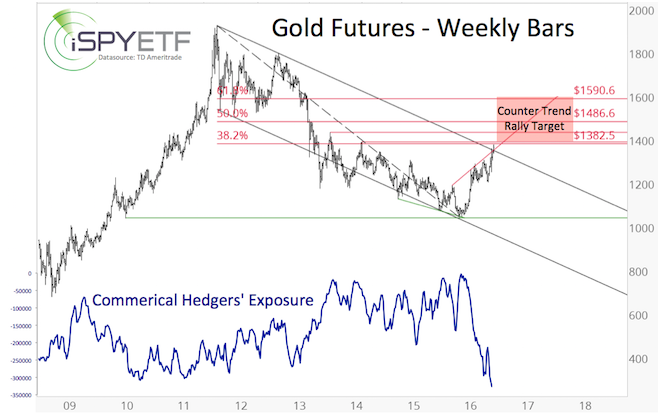
The BIG QUESTION was whether the gold rally was over for good, or if gold would rally above 1,380 following its correction.
Below $1,000/oz Now?
In the second half of 2016, gold fell from 1,377 to 1,124 (on December 15).
We expected gold to find support around 1,200 (horizontal red bar), but it did not.
The December 18, 2016 Profit Radar Report featured the chart below and commented: “Gold is approaching longer-term support at 1,120 – 1,105. Based on seasonality, cycles and short-term sentiment, there is a very good chance gold will find support, and rally from, the 1,120 – 1,105 range.”
$1,400/oz or below $1,000/oz?
Gold bounced from 1,124.5 and rallied over $90 since.
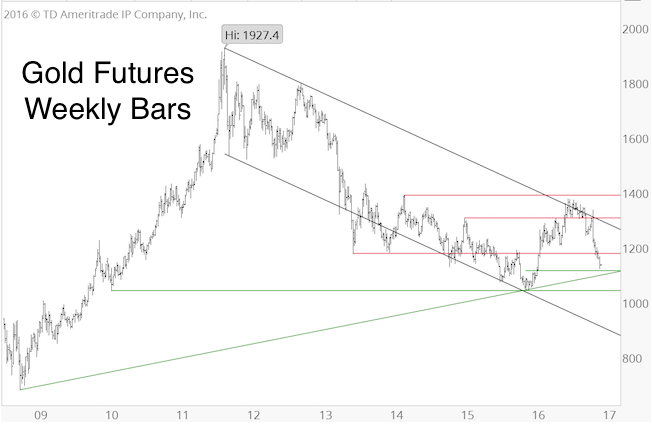
The BIG QUESTION now is whether gold will complete its ‘unfinished business’ and move above 1,380, or relapse below 1,000.
Short-term, gold is in the red resistance zone (see first chart) and seems due for a digestive pullback. If such a pullback looks corrective, gold has a good shot of surpassing 1,380 in 2017 (this is our preferred scenario).
Trade above 1,380 would likely present a great opportunity to go short and lead to a drop below $1,000/oz.
Continuous gold analysis is available via the Profit Radar Report.
Simon Maierhofer is the founder of iSPYETF and the publisher of the Profit Radar Report. Barron's rated iSPYETF as a "trader with a good track record" (click here for Barron's profile of the Profit Radar Report). The Profit Radar Report presents complex market analysis (S&P 500, Dow Jones, gold, silver, euro and bonds) in an easy format. Technical analysis, sentiment indicators, seasonal patterns and common sense are all wrapped up into two or more easy-to-read weekly updates. All Profit Radar Report recommendations resulted in a 59.51% net gain in 2013, 17.59% in 2014, and 24.52% in 2015.
Follow Simon on Twitter @ iSPYETF or sign up for the FREE iSPYETF Newsletter to get actionable ETF trade ideas delivered for free.

If you enjoy quality, hand-crafted research, >> Sign up for the FREE iSPYETF Newsletter
|
