Subscribers to iSPYETF’s free e-mail newsletter receive a market outlook, usually once a week. The market outlook below was sent out on May 12, 2022 If you’d like to sign up for the free e-newsletter, you may do so here (we will never share your e-mail with anyone, just as we don't accept advertising).
The S&P 500 reached the 4,000 zone this week, which has been our potential down side target for a while (April 13 Profit Radar Report). The area surrounding 4,000 was an inflection zone where a bounce would become more likely.
Since the S&P did not react to this support zone, price can slice lower into our next target zone.
Down side momentum picked up and breadth has turned horrible. Is it bad enough where it’s actually good for stocks?
I’d like to share some stats on how the S&P 500 performed in the past when breadth was as bad as last week. This is from Sunday’s Profit Radar Report:
“Another bruising day dropped the S&P 500 right into the 4,000 zone. At the end of the day, the S&P fell 3.20% with only 11.83% of NYSE-traded stocks advancing (on only 7% of volume, based on preliminary data). This followed Wednesday’s 3.56% / 5.30% / 11.87% day.
Most breadth readings are at the lowest level since the pandemic low.
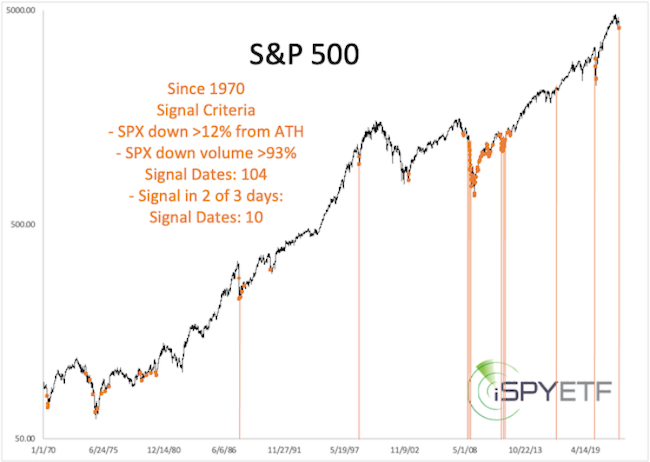
Sunday’s PRR highlighted similar down days. 10 of the 25 signals saw extreme clusters (down volume >93% on 2 of 3 days, orange lines). Even though the 2008 meltdown hosted 3 of those 10 signals, 1, 2, 6, 12 month later the S&P was higher 9 out of 10 times.
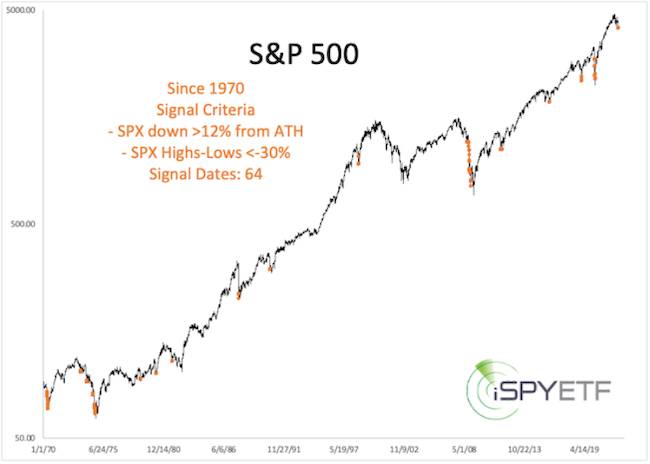
The percentage of 52-week highs minus low was at -30.90%. The chart below shows the 64 signal dates with more than -30% while more than 12% from the all-time high.
Similar to prior studies, many clusters fall into the ominous years of 1974, 1987, 2008/09, 2020.
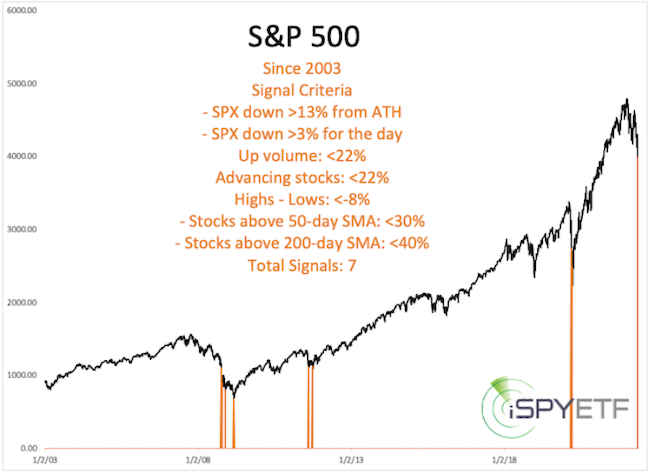
The study below has a shorter history (since 2003) but includes more indicators. Again we see 2008, 2020 and 2012."
What does all of this mean?
Looking at similar 'events' in the past provides a gauge of what would be normal to expect in the future.
A 2008-like event is always an outlier event. Based on the data it's possible, but such an extended meltdown seems unlikely.
While below 4,000, the S&P can continue lower into our next target range. Some indicators are already in 'it's so bad it's good' territory, and if stocks fall into the target range, we'll probably buy to take advantage of a bounce. Whether such a bounce could still set new all-time high would be evaluated at the time
Continuous updates and fact-based, out-of-the box analysis is available via the Profit Radar Report.
The Profit Radar Report comes with a 30-day money back guarantee, but fair warning: 90% of users stay on beyond 30 days.
Barron's rates iSPYETF a "trader with a good track record," and Investor's Business Daily writes "Simon says and the market is playing along."
Subscribers to iSPYETF’s free e-mail newsletter receive a market outlook, usually once a week. The market outlook below was sent out on May 5, 2022. If you’d like to sign up for the free e-newsletter, you may do so here (we will never share your e-mail with anyone, just as we don't accept advertising).
Yesterday the S&P 500 delivered the biggest one-day pop since April 20, 2020, that's more than 2 years ago.
Trading and advising through the 2008/09 meltdown I remember that some of the biggest pops happen during bear markets.
And I distinctly remember that the 'big pop in bear markets' notion made a comeback in the post-pandemic rally (it obviously wasn't true then). So what do big pops really mean?
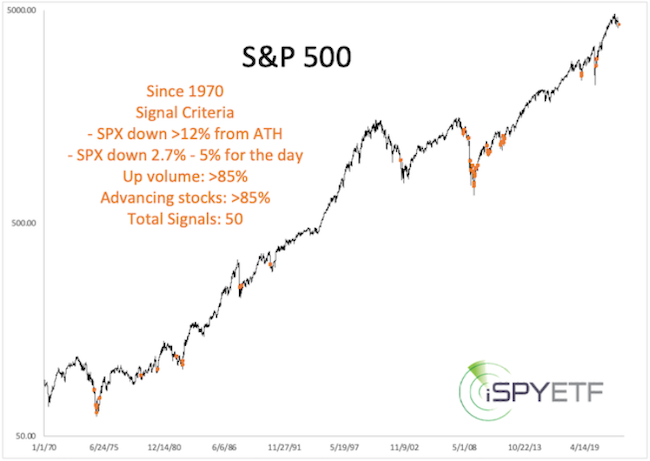
To find out I isolated dates where the S&P gained more than 2.7% with more than 80% of stocks advancing (on more than 80% of volume) while down more than 12% from its all-time high.
There were 50 signal dates since 1970, all of them highlighted below. More often than not those kind of pops occurred going into or coming out of a significant low. But, there were those 2002, 2008/09 instances that preceded a meltdown.
The S&P is down more today than it was up yesterday, so that will be another interesting study for the next Profit Radar Report: What happens after big up/down days? If you want to find out, sign up for the Profit Radar Report.
The April 13 Profit Radar Report stated that: "The S&P could fall towards and even below 4,000 before giving away whether option 1 or 2 is playing out."
S&P 4,000 is not far away so we should soon find out.
Last Friday, the S&P closed at the lowest level since May 19, 2021. Since last Friday was the last day of April, it was also the publication day of the monthly Sentiment Picture.
The Sentiment Picture consists of two parts:
1) Charting various sentiment gauges (see chart below)
2) Identifying other times with similar sentiment readings and how the S&P 500 performed thereafter.
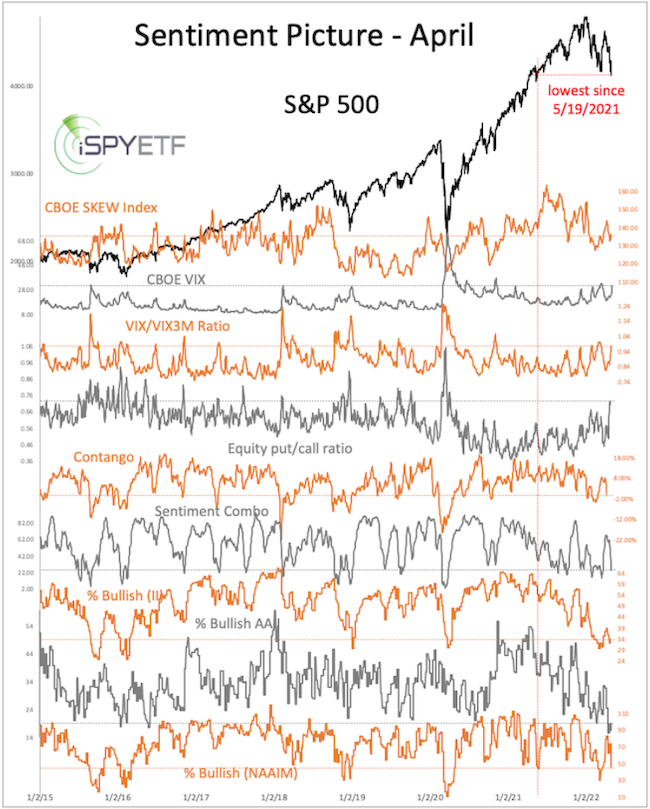
As you can see, there were a couple of sentiment extremes, but sentiment indicators aren't as bearish perhaps the media. Is that good or bad for stocks?
The answer along with usually out-of-the-box but always fact-based analysis is available via the Profit Radar Report.
The Profit Radar Report comes with a 30-day money back guarantee, but fair warning: 90% of users stay on beyond 30 days.
Barron's rates iSPYETF a "trader with a good track record," and Investor's Business Daily writes "Simon says and the market is playing along."
|
