Subscribers to iSPYETF’s free e-mail newsletter receive a market outlook, usually once a week. The market outlook below was sent out on April 1, 2021. If you’d like to sign up for the free e-newsletter, you may do so here (we will never share your e-mail with anyone, just as we don't accept advertising).
As mentioned earlier this week, 1st of the month and quarter inflows are moving stocks higher today, and the S&P 500 is on track to close at a new all-time high ... if it doesn't sell off in a bit.
Throughout 2021, the S&P has struggled to keep gains in the last hour. It's said that the 'smart money' makes its move in the last hour. There's even a last hour indicator, and it says that, historically, new all-time highs against persistent last hour selling have not been good for stocks. It hasn't mattered thus far in 2021.
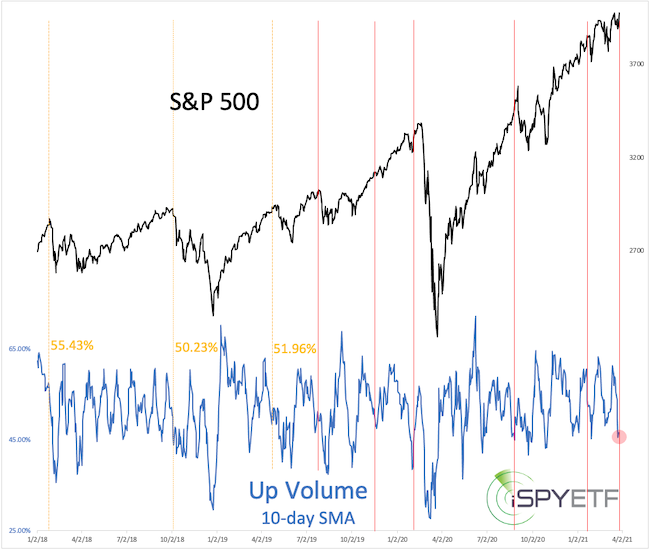
Perhaps more concerning is the lack of volume behind the latest S&P 500 perk up. I published this observation in Sunday's Profit Radar Report:
"Despite the new S&P 500 all-time high, the 10-day SMA of volume flowing into advancing stocks was only 46.46%.
The chart below plots the S&P 500 against the 10-day SMA of NYSE up volume. The red lines highlight every S&P 500 all-time high when NYSE up volume was below 50%.
The yellow lines highlight new all-time highs when NYSE up volume was above 50% but still weak. Aside from 11/18/19, this resulted in some weakness every time. For objectivity sake, there was also a cluster of similar constellations in mid-October 2017 (the S&P 500 remained flat for 2-4 weeks before soaring higher)."
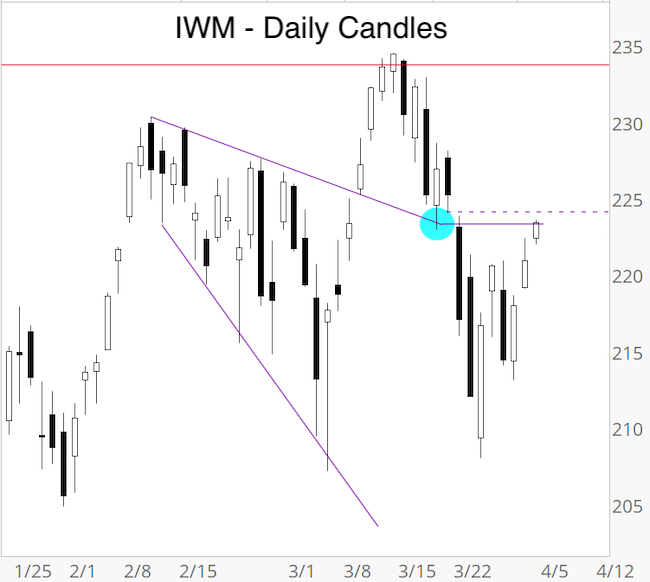
IWM (iShares Russell 2000 ETF) is getting close to the open chart gap (dashed purple line) we've been watching. There is also general resistance around 224, which will probably be the biggest test for this bounce.
Last Thursday, for the first time since 5/27/20 (209 days), the US dollar closed above it's 200-day SMA.
Since 1970, the US dollar traded below its 200-day SMA for >160 days 13 other times, 9 of those 13 times it remained below the 200-day SMA for >200 days.
The green bars below highlight the last 200 days of any >200 day streak, the dashed green lines highlight the end of any >160 but <200 day streak.
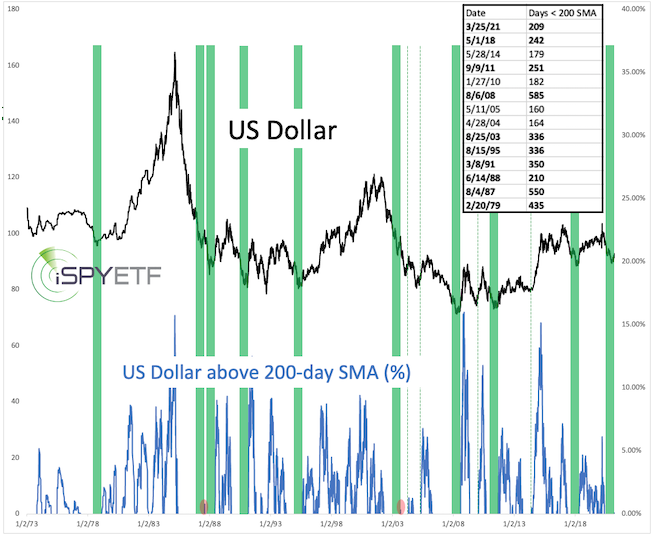
The US dollar is more than just a currency, it's the world's reserve currency, and the breakout above the 200-day SMA is a big deal ... or is it?
Sunday's Profit Radar Report shows detailed studies on how the US dollar, S&P 500 and gold performed after the US dollar closed above the 200-day SMA for the first time in 200 days.
The performance tracker shows detailed forward performance graphs and actual returns for the next 1, 2, 3, 6, 9 and 12 months.
Now is not a time to be flying in the dark.
The 10-year Treasury Yield is just easing off the biggest rally in its history. Here is the latest outlook for 10-year Treasury Yields and 30-year Treasuries (TLT).
Commodity inflation has hit a bit of a speed bump. Here is the latest commodity analysis.
Continued updates and factual out-of-the box analysis are available via the Profit Radar Report.
The Profit Radar Report comes with a 30-day money back guarantee, but fair warning: 90% of users stay on beyond 30 days.
Barron's rates iSPYETF a "trader with a good track record," and Investor's Business Daily writes "Simon says and the market is playing along."
|
