On Thursday, February 11, the S&P 500 dropped to new lows, which was our minimum down side target outlined in the January 27 Profit Radar Report: “We are looking for some short-term up side followed by new lows, followed by a more sustainable rally.”
Thursday’s (Feb. 11) special Profit Radar Report update recommended to buy at S&P 1,828 and listed six reasons for a rally. Below is an excerpt from Thursday’s Profit Radar Report.
“Forrest Gump would probably describe this market as a ‘box of chocolate.’ Let’s open the box and look what we’ve got.
Obviously, momentum is to the down side. Betting against momentum is always a risky proposition. Having said that, there are a number or tell-tale signs hinting of a (temporary?) momentum shift.
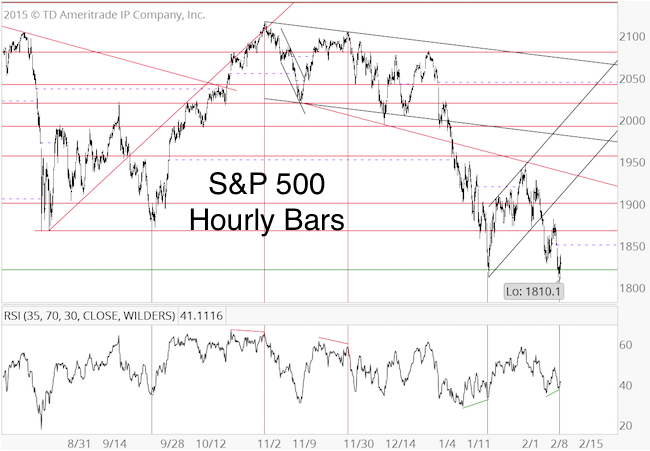
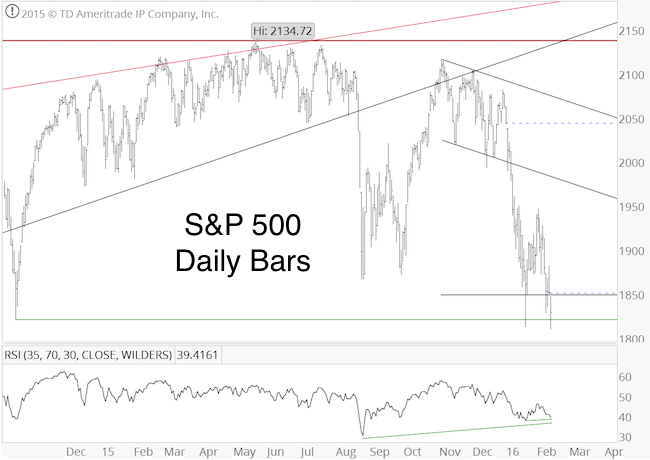
1) Today’s open left another chart gap (first and second S&P 500 chart, dashed purple lines).
2) There’s a bullish RSI divergence on the hourly chart (first chart).
3) There’s a bullish RSI divergence on the daily chart (second chart).
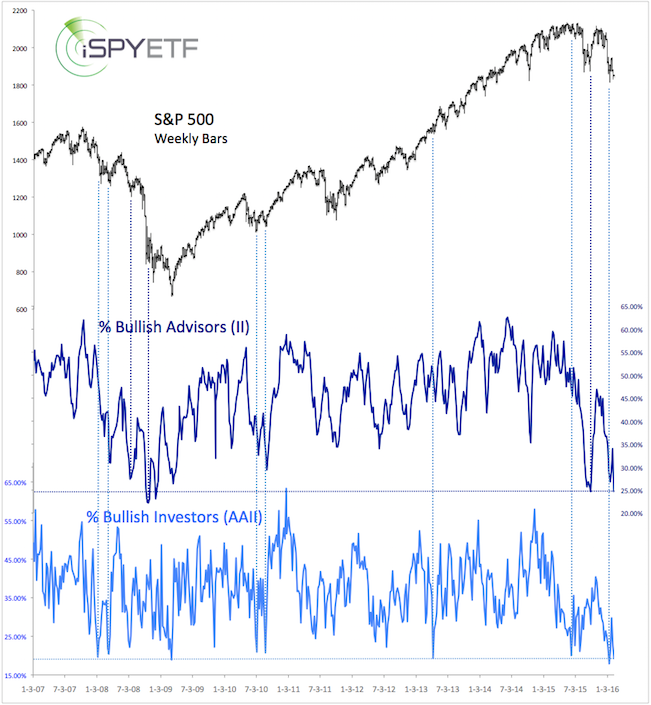
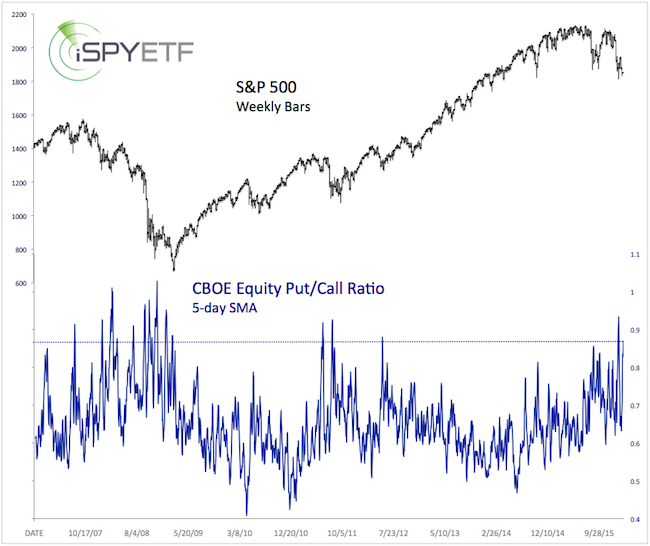
4) Some investor sentiment gauges are nearing pessimistic extremes (third chart). Longer-term sentiment readings (such as the II and AAII polls shown below) suggest a bullish bias for the coming months. Short-term sentiment readings (such as the CBOE equity/put call ratio – fourth chart) are not yet in nosebleed territory and allow for further losses.
If you enjoy quality, hand-crafted research, >> Sign up for the FREE iSPYETF Newsletter
5) Today’s low could be the spring board for the updated projection shown in Wednesday's PRR.
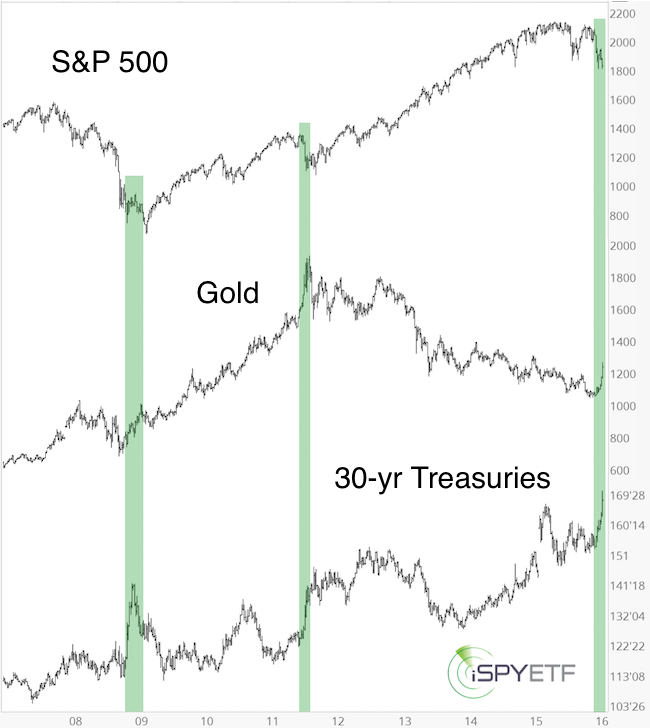
6) Based on correlations between asset classes, investors are piling into the ‘fear trade’ (buying gold and Treasuries when stocks are down). 30-year Treasury prices and gold are up more than 10% in recent weeks. This combination (gold and Treasuries up more than 10% in a couple of weeks) has only occurred three other times since 1975 (according to SentimenTrader). Chart #5 captures the November 2008 and August 2011 occurrences. In 1982 (not shown), the S&P bottomed closely thereafter, and rallied 44% over the next year.
If you enjoy quality, hand-crafted research, >> Sign up for the FREE iSPYETF Newsletter
Summary: Although we anticipate an eventual drop below S&P 1,800, today’s lows increase the odds of at least a temporary rally. The risk/reward ratio is now attractive. Buy S&P 500 around 1,828 or SPY around 183.”
Although this rally may relapse eventually, Thursday’s dip provided a low-risk entry, to get some ‘skin in the game’ in case this turns into a runaway rally with higher than anticipated targets.
The S&P 500 has been tracking our yellow projection (see chart below) - initially published in the January 13 and 24 Profit Radar Report updates - very well, and may continue to do so.
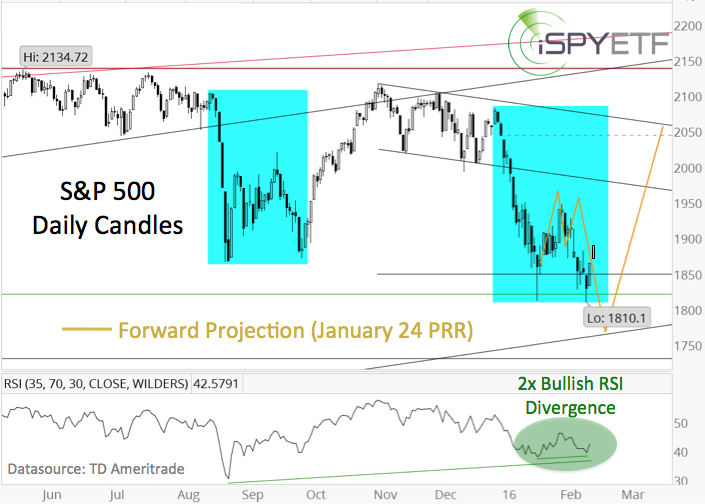
Please keep in mind that the yellow projection was adjusted via the Wednesday, February 10, Profit Radar Report to show only a marginal low followed by a less dynamic bounce.
The updated projection with target levels is available here.
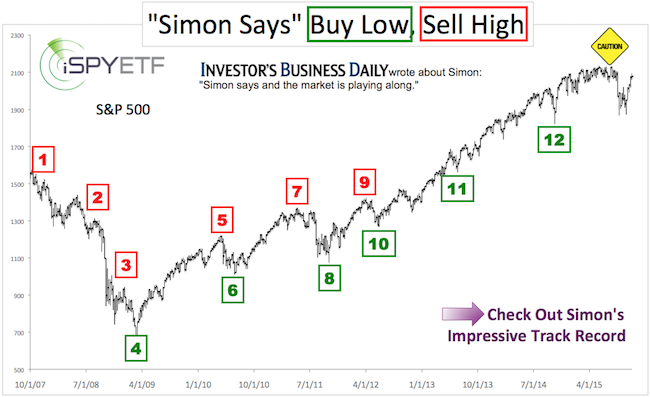
Simon Maierhofer is the publisher of the Profit Radar Report. The Profit Radar Report presents complex market analysis (S&P 500, Dow Jones, gold, silver, euro and bonds) in an easy format. Technical analysis, sentiment indicators, seasonal patterns and common sense are all wrapped up into two or more easy-to-read weekly updates. All Profit Radar Report recommendations resulted in a 59.51% net gain in 2013, 17.59% in 2014, and 24.52% in 2015.
Follow Simon on Twitter @ iSPYETF or sign up for the FREE iSPYETF Newsletter to get actionable ETF trade ideas delivered for free.
If you enjoy quality, hand-crafted research, >> Sign up for the FREE iSPYETF Newsletter
|
