The rally from the June 3 low has created many bullish price and breadth patterns and studies (5 of them are discussed here). The market has followed through on them thus far.
However, the short-term Elliott Wave structure does not look bullish, and the long-term projection published in the June 2 Profit Radar Report (shown here) points to a serious speed bump.
In short, there is a measure of conflict between indicators. When that happens, I like to go back to the basics and keep it simple.
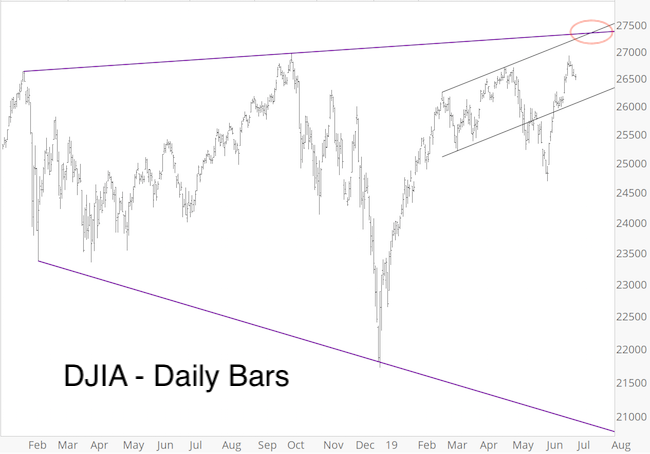
Resistance
The DJIA shows probably the most important resistance range to watch: around 27,300.
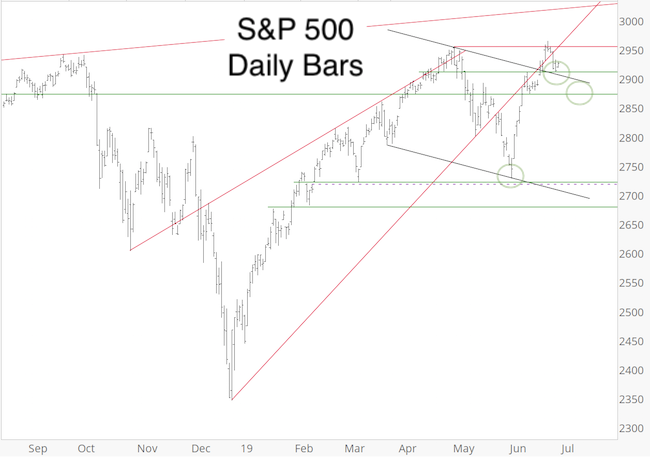
Support
The S&P 500 shows some important support levels to watch: around 2,910 and 2,875.
If you enjoy quality, hand-crafted research, >> Sign up for the FREE iSPYETF e-Newsletter
Short-term Trend Channel
The June 23 Profit Radar Report used this chart to simplify the short-term: “A break below channel support would unlock a pullback. The wave labels show the most bearish EWT-based option. It’s not ideal, but it seems more likely than other options.”
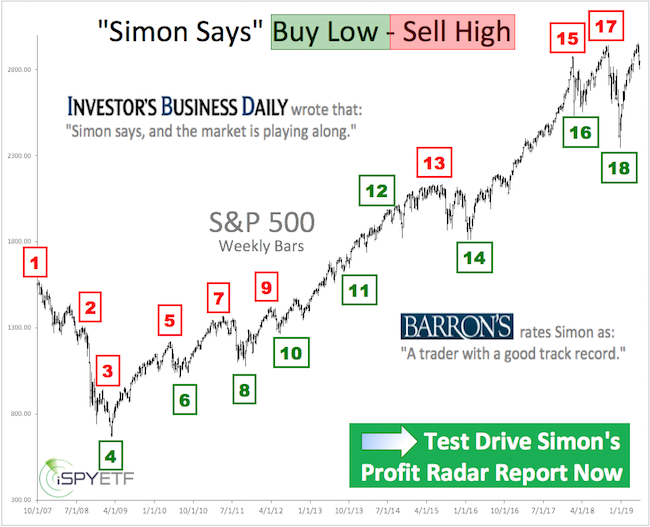
Barron's rates iSPYETF as "trader with a good track record" and Investor's Business Daily says: "When Simon says, the market listens." Find out why Barron's and IBD endorse Simon Maierhofer's Profit Radar Report.
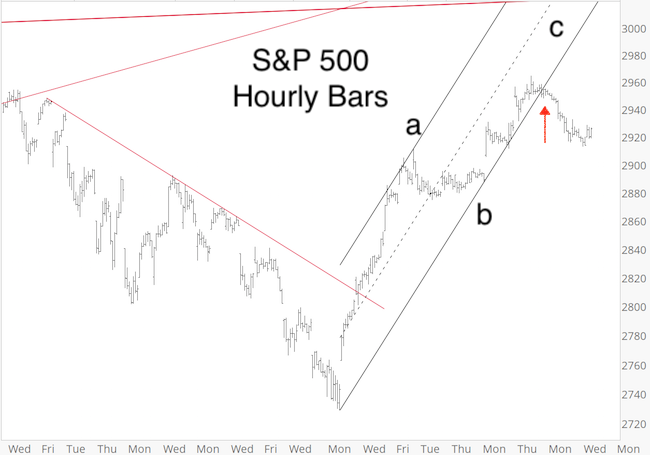
Trend channel support failed the next day and unlocked the biggest pullback of June. It is possible to count the decline from June 21 as 5 waves, which cautions that the trend may have changed from up to down.
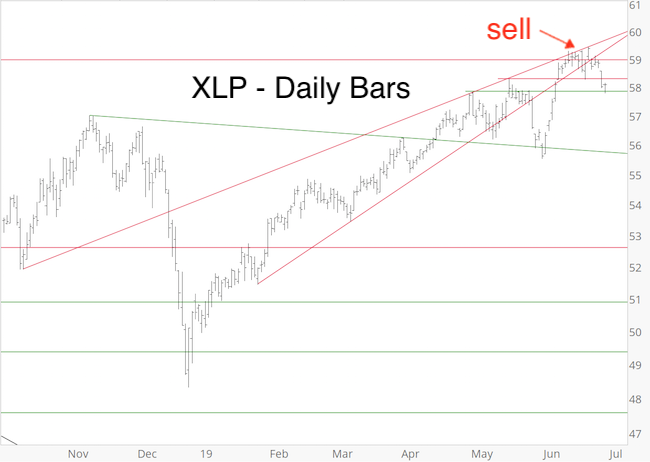
Leader Fatigue
The rally from the June low has been led by defensive sectors like consumer staples. Contrary to popular belief, such (defensive-led) rallies are statistically not doomed to fail.
However, the Consumer Staples Select Sector SPDR ETF (XLP) carved out a pattern with a lot of bearish potential. I recommended to go short at 59.07 on June 13. The stop-loss is now set at breakeven, which allows us to ‘play with house money.’
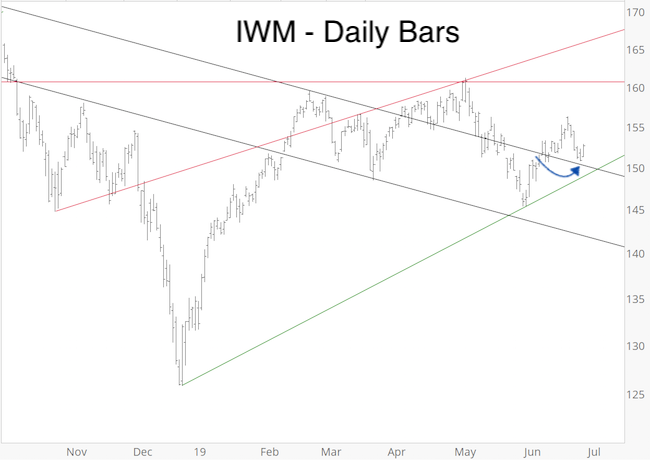
Overlap
Small cap stocks represented by the Russell 2000 ETF (IWM) are lagging. In fact, IWM fell below the June 5 high. If one wanted to count the June rally as 5 waves, June 5 would be wave 1, but yesterday price dropped below the June 5 high. This creates a bearish (wave 4 / wave 1) overlap (blue arrow) that’s not allowed and voids a short-term bullish Elliott Wave count.
Bearish Constellation
Not only small caps are lagging. The transportation and banking sector are too (see chart below).
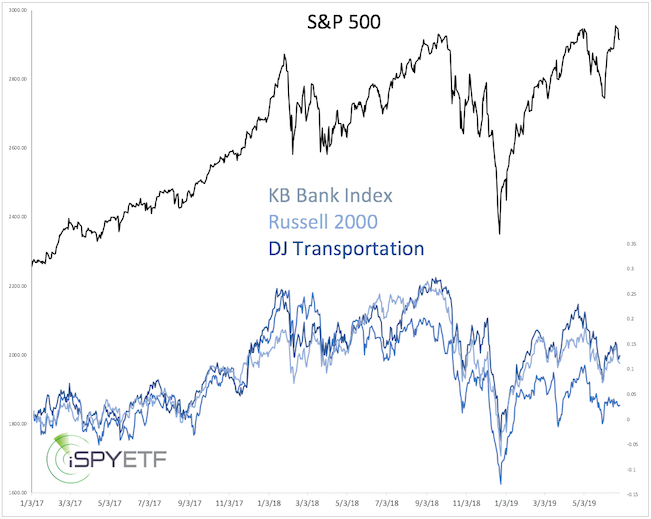
Only two other times (July 1990 and July 1998) has there been such a big divergence between the S&P 500 and small caps, transportation, and banking. This is a small sample size, but it led to a rocky and negative performance over the next quarter.
Conclusion
Even during times where there is conflict among indicators, going back to the basics provides some general guidance.
It will take a sustained move above resistance to unlock higher targets, and a break below support to unlock lower targets.
Another big but temporary drop would certainly clear up the structure and provide a lot more certainty, but we'll let the above levels indicate whether it will happen.
Continued updates are available via the Profit Radar Report.
Simon Maierhofer is the founder of iSPYETF and the publisher of the Profit Radar Report. Barron's rated iSPYETF as a "trader with a good track record" (click here for Barron's evaluation of the Profit Radar Report). The Profit Radar Report presents complex market analysis (S&P 500, Dow Jones, gold, silver, euro and bonds) in an easy format. Technical analysis, sentiment indicators, seasonal patterns and common sense are all wrapped up into two or more easy-to-read weekly updates. All Profit Radar Report recommendations resulted in a 59.51% net gain in 2013, 17.59% in 2014, 24.52% in 2015, 52.26% in 2016, and 23.39% in 2017.
|