Subscribers to iSPYETF’s free e-mail newsletter receive a market outlook, usually once a week. The market outlook below was sent out on October 13, 2022. If you’d like to sign up for the free e-newsletter, you may do so here (we will never share your e-mail with anyone, just as we don't accept advertising).
For months, the S&P 500 has been following the expanding diagonal pattern. This has been a surprisingly easy way to navigate an uber complicated political and economical environment.
If you haven't read about the pattern that's almost worked like painting by numbers, you can check it out here:
S&P 500 Path Deceptively Simple
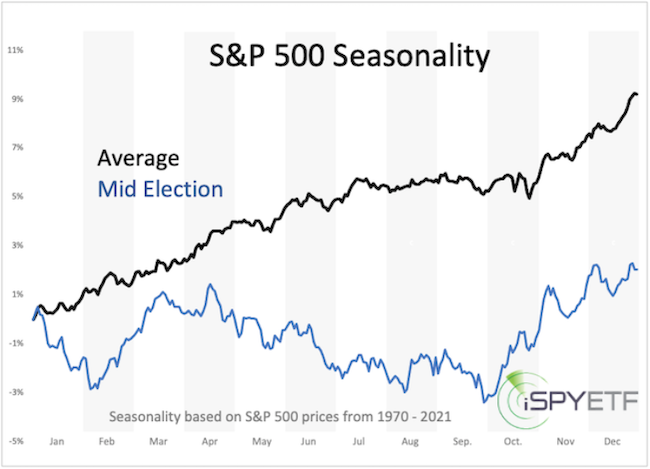
As shocking as the 2022 stock market performance has been to most, it is actually very much in line with another historic pattern; the 4-year presidential election cycle:
"2022 is the mid election year, which is the weakest of the 4-year presidential election year cycle. Historically (going back to 1950), the S&P 500 declines on average about 20% into the mid-term election year low.
The following year (the pre election year, 2023) is the strongest year of the election year cycle as incumbent presidents prime the pump to increase the odds of reelection. Historically, the S&P 500 gains on average about 50% from the mid election year low to the pre election year high.
Cycles project a fair amount of political and economic turmoil starting in Q1 of 2022. Based on seasonality and cycles, 2022 will be a tough year to navigate where high stocks prices early in the year should be used to raise cash for a better buying opportunity later in the year."
Some may say; ‘hindsight is 20/20, it's easy to point this out after the fact,’ but I wrote the above in my 2022 S&P 500 Forecast, published for Profit Radar Report subscribers back in January.
The S&P 500 mid election year seasonality chart that accompanied the above commentary highlights the tendency of a Q4 low.
Is it a fools errand to write about a buying opportunity in a bear market? That's an interesting question, and my answer along with an interesting statistic is available here.
Does the expanding diagonal pattern and election year cycle guarantee that stocks will rally? Of course not. There are no guarantees in life or investing.
But, and that's a big but, the odds of an upcoming rally are much higher than many believe them to be.
Of course I'm not recommending to buy blindly, but I am keeping my eyes peeled for breadth and sentiment extremes or divergences that tend to be seen near meaningful lows. I discussed one divergence, that happened this week for the first time in 2022, in yesterday's Profit Radar Report update.
Since then, S&P 500 Futures dropped as low as 3,502 and soared 150 points over the last 3 hours.
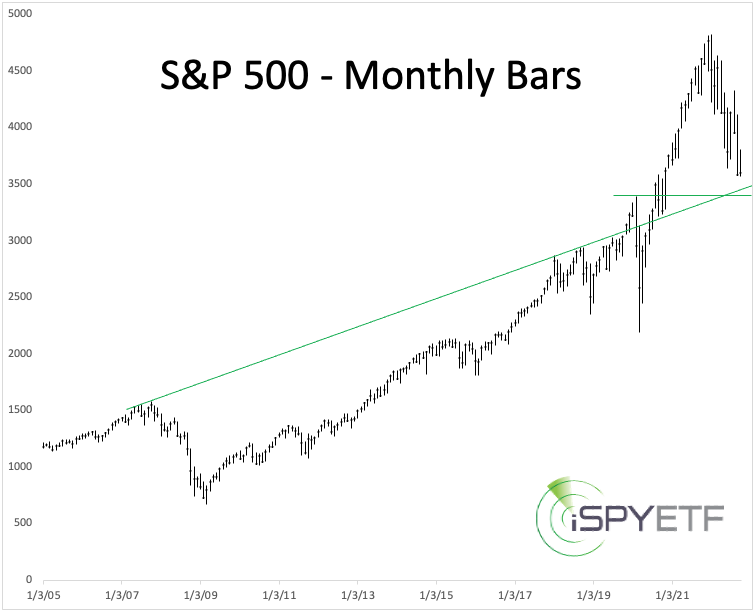
The above long-term support chart may be helpful in identifying a buying opportunity (or failure of one).
If you want to be the best-informed investor you know, and have access to always relevant and purely fact-based research, sign up for the Profit Radar Report.
The Profit Radar Report comes with a 30-day money back guarantee, but fair warning: 90% of users stay on beyond 30 days.
Barron's rates iSPYETF a "trader with a good track record," and Investor's Business Daily writes "Simon says and the market is playing along."
|
