Have you even seen a black swan, I mean the actual bird? Probably not, because they are extremely rare.
That’s why the black swan has been used to describe extremely rare outlier stock market events. ‘Event’ is simply a nice way of saying crash or meltdown.
Black swan events are as rare as they are unpredictable, but the CBOE (the same outfit to create the VIX) crafted an index designed to measure the risk of a black swan event. This index is called the SKEW Index.
Barron's rates iSPYETF as "trader with a good track record" and Investor's Business Daily says: "When Simon says, the market listens." Find out why Barron's and IBD endorse Simon Maierhofer's Profit Radar Report
Here is the main difference between the VIX and SKEW: The VIX is based on implied volatility of S&P 500 at-the-money options while the SKEW is based on implied volatility of far out-of-the-money S&P 500 options.
Here is how the SKEW works: Readings of 100 mean that the risk of a black swan event is low. For every 5-point increase in the SKEW Index, the risk of a black swan event increases 1.4%.
On Friday, the SKEW Index closed at 155.31, which is the second highest reading since 1990 (as far back as SKEW data goes). A reading of 155 also means that the risk of a black swan event is 15.4% higher than usual.
With the theoretical stuff out of the way, let’s see if the SKEW Index actually works.
Does the SKEW work?
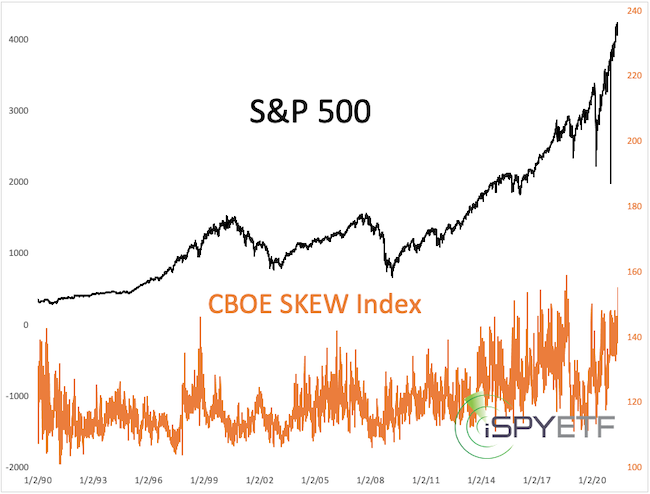
The chart below plots the S&P 500 agains the SKEW Index (going back to 1990). The SKEW moved above 150 only on 17 of 12,967 trading days (that’s 0.13% of the time). And none of those 17 days happened before 2015.
If you enjoy quality, hand-crafted research, sign up for the FREE iSPYETF e-newsletter & market outlook
The next chart makes it easier to identify those 17 times. Here are the key takeaways:
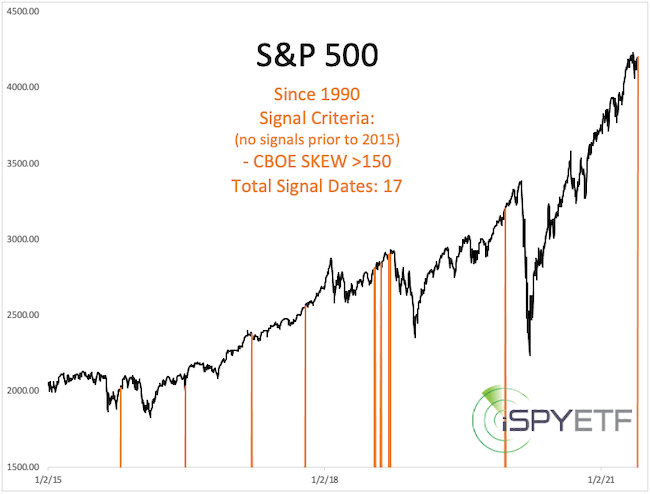
13 of the 16 prior signals (81%) saw any gains erased within the next 3 month
3 of the 16 prior signals (19%) saw significant further gains (2 of those gains were erased within 18 months)
Summary
The SKEW Index deserves credit for flashing warning signals prior to the 2016, 2018 and 2020 declines. It needs to be noted though that those signals were about 2 months too early. It will take a break below support to edge the potential black swan risk closer to reality.
Continuous updates are available via the Profit Radar Report.
Simon Maierhofer is the founder of iSPYETF and the publisher of the Profit Radar Report. Barron's rated iSPYETF as a "trader with a good track record" (click here for Barron's evaluation of the Profit Radar Report). The Profit Radar Report presents complex market analysis (S&P 500, Dow Jones, gold, silver, euro and bonds) in an easy format. Technical analysis, sentiment indicators, seasonal patterns and common sense are all wrapped up into two or more easy-to-read weekly updates.
|