|
|
| XLF Financial ETF Breaks above Resistance to New 6-year High |
| By, Simon Maierhofer
|
| Friday August 22, 2014 |
|
|
|
|
| XLF just soared to new highs not seen since September 2008. Perhaps more interesting than this new high is the pattern of this breakout. Interestingly, this week’s XLF push mimics the June breakout almost tit for tat. |
|
The Financial Select Sector SPDR ETF (NYSEArca: XLF) has been on fire and just busted through resistance that kept a lid on prices throughout July.
The XLF chart below shows Thursday’s breakout along with various other support/resistance levels highlighted in the past.
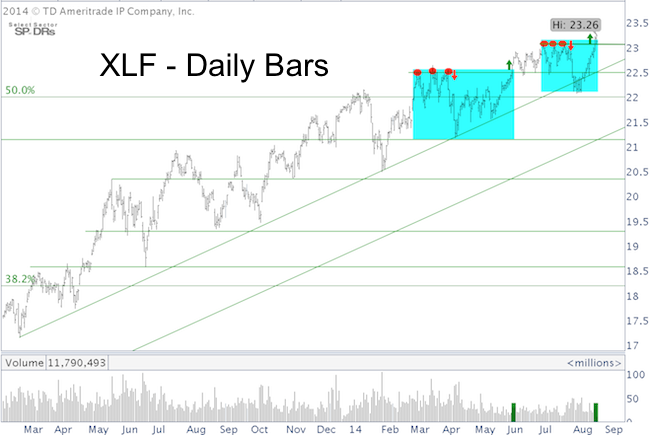
The blue boxes highlight the similarities between two recent patterns:
-
Triple top (red dots)
-
Selloff (red arrows)
-
Eventual break to new highs (green arrows) on elevated volume (green boxes)
The question on most investors' minds is whether this breakout will stick.
If the pattern repeats itself, XLF would enjoy limited upside, a consolidation period and another pullback.
I am not sure if the pattern will repeat, however the prior resistance right around 23.05 is likely to act as support in the days/weeks to come. A drop back below 23 would caution that the bullish breakout is due for a pause.
Simon Maierhofer is the publisher of the Profit Radar Report. The Profit Radar Report presents complex market analysis (S&P 500, Dow Jones, gold, silver, euro and bonds) in an easy format. Technical analysis, sentiment indicators, seasonal patterns and common sense are all wrapped up into two or more easy-to-read weekly updates. All Profit Radar Report recommendations resulted in a 59.51% net gain in 2013.
Follow Simon on Twitter @ iSPYETF or sign up for the FREE iSPYETF Newsletter to get actionable ETF trade ideas delivered for free.

|
|
|
|
|
|
|
|
|
|
|
|
|
|
