Active investment managers polled by the National Association for Active Investment Managers (NAAIM) were record long last week.
The significance of this indicator (or lack thereof) can easily be misconstrued and lead contrarian investors in the wrong direction.
This article will take a look at a couple of interesting twists revealed by deeper digging.
The chart below plots the S&P 500 (SNP: GSPC) against the average position of active investment managers polled by NAAIM.
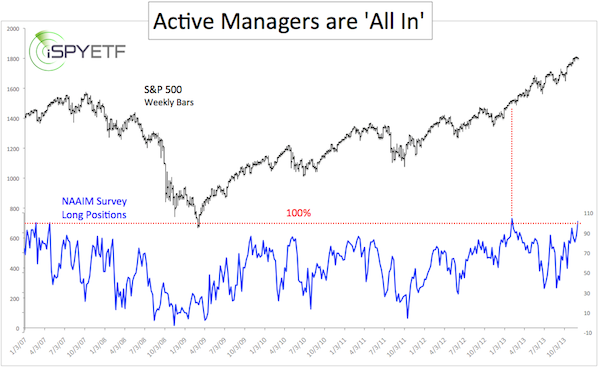
As of November 27 (the most recent data available) the average investment manager is 101.45% long. It’s impossible to be more than 100% long without margin, so the average investment manager is leveraged long.
The First Twist
From a contrarian point of view this sounds bearish. However, the chart also shows the last time active investment managers were leveraged long: January 30, 2013 (104.25%).
Investment managers’ appetite for stocks had no ill effect on the S&P 500 then. Could the current extreme be just another false alarm?
The Second Twist
Not all NAAIM position extremes are created equal. NAAIM also provides data on investment managers’ confidence in their bets and standard deviation of their allocation.
The second chart also plots the S&P 500 (NYSEArca: SPY) against the NAAIM average position and provides two additional data points: Managers’ confidence in their bet and the deviation among managers’ positions.
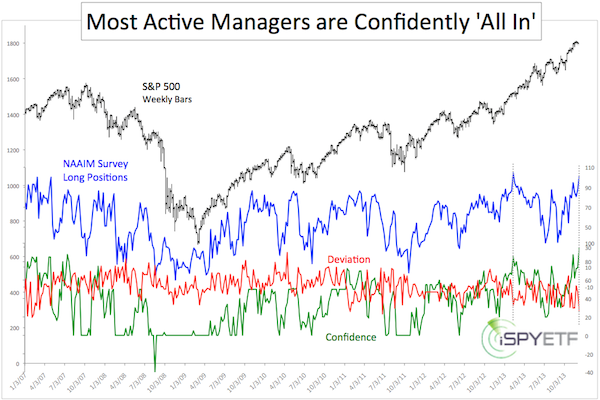
The green line shows managers’ confidence. More than three quarters of active investment managers are at least 95% long stocks. That’s the highest reading in the survey’s history.
Furthermore, there is a high degree of group think as the deviation is only 26.85%.
At the January NAAIM position extreme, three quarters of active investment managers were ‘only 85.25% long stocks with a deviation of 32.24%.
Untwisting the Knot
Based on the confidence in their decision and the lack of deviation among active managers, last week’s poll results may cause more of a headwind for stocks than in January.
The NAAIM poll is just one piece of the puzzle. There is another far more important, although less obvious, cause for stocks to correct further.
You can learn more about this force and a key price ‘control level’ here:
The ‘Invisible’ But Powerful Bearish Force
Simon Maierhofer is the publisher of the Profit Radar Report. The Profit Radar Report uses technical analysis, dozens of investor sentiment gauges, seasonal patterns and a healthy portion of common sense to spot low-risk, high probability trades (see track record below).
Follow Simon on Twitter @ iSPYETF or sign up for the iSPYETF Newsletter to get actionable ETF trade ideas delivered for free.

|
