There’s a time to speak and a time to be silent. You may have noticed that it’s been kind of ‘silent’ here at iSPYETF. Why?
There hasn’t been much new to report since we last looked at the S&P 500 on September 11.
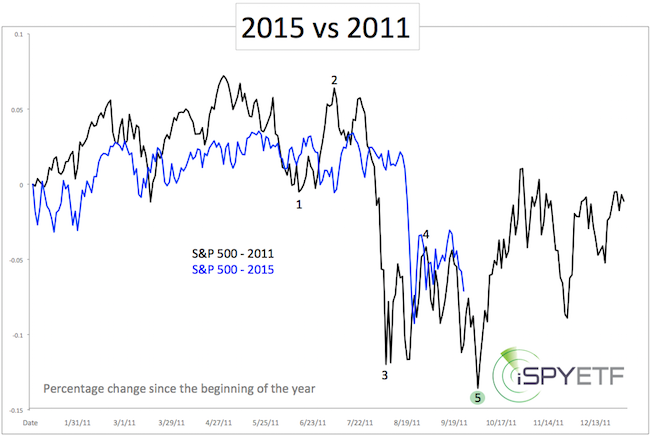
The September 11 article “S&P 500 Analysis – The Next Turn” referred to the parallels between the S&P 500 of 2011 and S&P 500 of 2015.
Based on this analogy, we expected the S&P 500 to edge higher in a choppy fashion and eventually relapse to retest or break the initial August panic low at 1,867.
The article stated that: “There are a number of other possibilities, but at this point there is no reason to complicate matters. If the next moves don’t match our parameters (many of which were already shared with Profit Radar Report subscribers), we’ll adjust.”
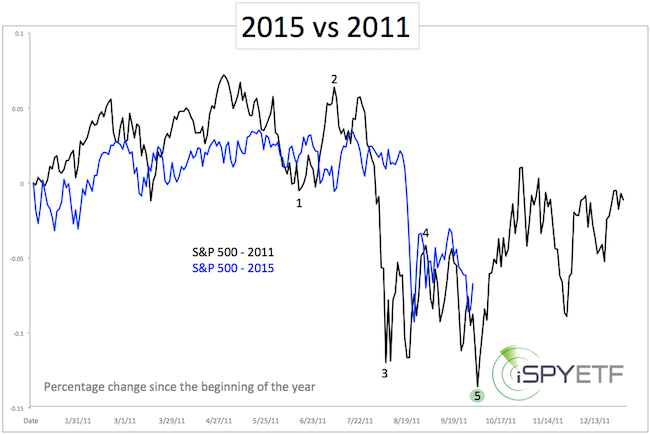
It is rare for me to focus on just one outcome, but based on literally dozens of indicators and data points, the odds favored a path similar to what we saw in 2011 (updated chart below).

Thus far the S&P 500 has followed the outline almost perfectly, and there has been no reason to adjust.
If you enjoy quality, hand-crafted research, >> Sign up for the FREE iSPYETF Newsletter
While it looks like the S&P is now on its way to re-test or break 1,867, there is no time to gloat or rest either.
When things become too obvious, the market has a way of making things interesting and often delivers a curveball.
The market is always the final authority, but based on my indicators, we would be interested to buy new lows.
Target levels for a tradable price low and the scope of the next rally (bounce or new bull market highs) are available to Profit Radar Report subscribers.
Updated Chart (10-1-2015)

Simon Maierhofer is the publisher of the Profit Radar Report. The Profit Radar Report presents complex market analysis (S&P 500, Dow Jones, gold, silver, euro and bonds) in an easy format. Technical analysis, sentiment indicators, seasonal patterns and common sense are all wrapped up into two or more easy-to-read weekly updates. All Profit Radar Report recommendations resulted in a 59.51% net gain in 2013 and 17.59% in 2014.
Follow Simon on Twitter @ iSPYETF or sign up for the FREE iSPYETF Newsletter to get actionable ETF trade ideas delivered for free.

If you enjoy quality, hand-crafted research, >> Sign up for the FREE iSPYETF Newsletter
|