A rising tide lifts all boats, but liquidity is no longer buoying all stock market segments. Small cap stocks continue to underperform the large cap Dow Jones and S&P 500 (SNP: ^GSPC) significantly.
Since we’re talking about tides, here’s another fun quote from Warren Buffett:
“Only when the tide goes out do you discover who’s been swimming naked.”
Will the small cap weakness soon expose large cap investors?
The chart below quantifies the underperformance of the small cap iShares Russell 2000 ETF (NYSEArca: IWM) compared to the large cap iShares Russell 1000 ETF (NYSEArca: IWB).
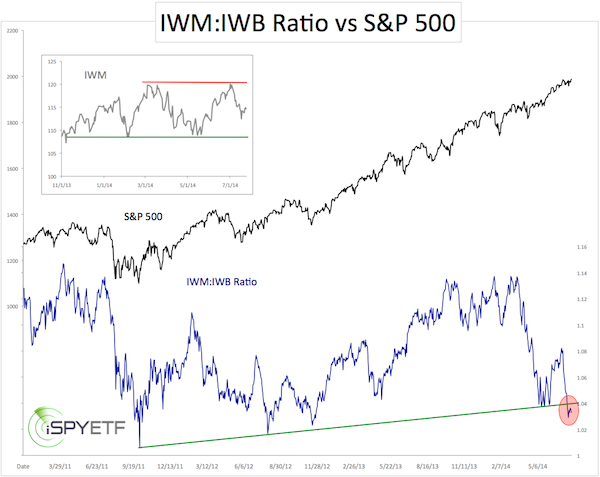
The IWM:IWB ratio just dropped below a 22-month support level. Finding support at the same trend line in mid-May spurred a 150-point S&P 500 rally.
Will the IWM:IWB drop below support translate into an S&P 500 drop?
Not necessarily. Here’s what the July 13 Profit Radar Report said about small cap weakness:
“While the S&P 500 (NYSEArca: SPY) appears to be in another range, the Russell 2000 is once again under performing. When did we last see that move? March/April.
The May 14 PRR explained why this kind of constellation could result in higher prices: ‘For many months analysts have emphasized (and continue to emphasize) the need for a 10% correction. There are two ways stocks can correct: 1) Price 2) Time.
A price correction is straight-forward and easy to spot as stocks simply shed value. Time corrections are often overlooked by the investing masses as prolonged sideways trading covertly digests oversold readings and excessive sentiment.
What we’ve seen since February delivers both. The S&P 500 and Dow Jones have treaded water while the Nasdaq-100 and Russell 2000 already lost as much as 8.67% and 8.71%, the biggest correction in well over a year.’
Looking back, it is obvious that the S&P 500 did correct, not via a price correction, but a more covert time correction (the Nasdaq and Russell 2000 saw a 10% price correction).
Could the current S&P 500 trading range morph into another ‘time correction’ followed by another rally? Possibly. Some count this large cap/small cap divergence as bearish for the overall market, but both indexes can easily continue to bounce as long as the S&P remains above key support.”
The chart insert shows key support for IWM at 107.20 (the corresponding level for the Russell 2000 is 1,080).
Key support for the S&P 500 is discussed here (this support was identified on July 8 and has been successfully tested five times since).
Keeping an eye on key support is important, because overall market breadth is weaking, leaving the S&P 500 vulnerable for a correction once support fails. Click here to view key S&P 500 support: S&P 500 Support
Simon Maierhofer is the publisher of the Profit Radar Report. The Profit Radar Report presents complex market analysis (S&P 500, Dow Jones, gold, silver, euro and bonds) in an easy format. Technical analysis, sentiment indicators, seasonal patterns and common sense are all wrapped up into two or more easy-to-read weekly updates. All Profit Radar Report recommendations resulted in a 59.51% net gain in 2013.
Follow Simon on Twitter @ iSPYETF or sign up for the FREE iSPYETF Newsletter to get actionable ETF trade ideas delivered for free.

|
