The S&P 500 (SNP: ^GSPC) and Dow Jones came out of the gate strong this morning at 9:30am EST.
However, most investors didn’t see what the S&P 500 futures did overnight. Unlike the cash market (Wall Street), futures trade almost 24 hours a day from Sunday to Friday afternoon.
S&P 500 and Dow Jones futures had a rocky night as they dropped 12 and 78 points at 10pm EST. This may be significant. Why?
On November 29 (day of last all-time high for Dow Jones and S&P 500), the Profit Radar Report went short the Dow Jones at 16,100 and subsequently outlined a near-term down side target of 1,760 – 1,746 (S&P 500) and 15,750 – 15,590 (Dow Jones).
On Friday the Dow Jones (DJI: ^DJI) dropped into the down side target and we closed the short Dow trade.
Should we have stayed short and waited for lower prices?
Quite possibly. The 50-day SMA, part of the ideal target range, is still lower. But odds favor another rally leg soon and a bird in the hand is better than two in the bush.
Additionally, when the futures market dropped like a stone Sunday night at 10pm, it drew prices briefly below the 50-day SMA.
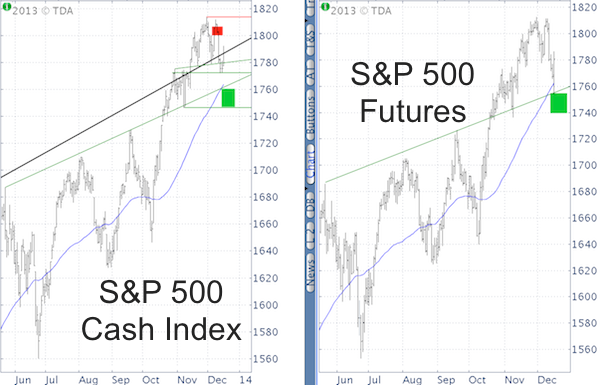
The chart below shows the S&P 500 and S&P 500 e-mini futures next to each other. Notice how the S&P 500 futures (right side) dipped below the 50-day SMA (blue line), while the S&P 500 cash index did not.
Sunday night’s mini futures hiccup was forgotten in the morning when the S&P 500 ETF (NYSEArca: SPY) and Dow Diamonds ETF (NYSEArca: DIA) gapped higher.
Unbeknownst to many though, the Dow and S&P may have completed their correction while we were sleeping.
If the cash indexes mimic the futures and test the ideal target range surrounding the 50-day SMA, it may be a good time to buy. Odds favor another rally leg ahead. We would use tight stop-loss protection as sentiment allows for a deeper sell off.
I’ll be monitoring many indicators/gauges and developments to see if and when we want to buy. One of them has a near-perfect track record of nailing market lows and buying opportunities. All the details about this indicator can be found here:
The Incredible VIX Market Bottom Indicator
Simon Maierhofer is the publisher of the Profit Radar Report. The Profit Radar Report presents complex market analysis (stocks, gold, silver, euro and bonds) in an easy format. Technical analysis, sentiment indicators, seasonal patterns and common sense are all wrapped up into two or more easy-to-read weekly updates. We are accountable for our work, because we track every recommendation (see track record below).
Follow Simon on Twitter @ iSPYETF or sign up for the FREE iSPYETF Newsletter to get actionable ETF trade ideas delivered for free.

|
