OPEC inaction, decreased consumption, new extraction methods. There are many reasons why oil ‘should’ be down.
However, none of them is (or was) predictable.
For example, back in June the Wall Street Journal and Forbes reported that oil demand is rising. Oil traded above $60 a barrel at that time.
Back in October, CBS News asked: “Could an oil price spike slam the US again?” The question turned out to be a mute point.
If the direction of oil prices is so obvious, why do the media and analysts continuously get it wrong?
Forecasting prices obviously entails more than slapping a news event on a price event after the fact.
Seasonality is an ingredient of every Profit Radar Report market forecasts.
The September 27 Profit Radar Report warned that: “Crude oil seasonality is positive for a few more days before turning sour, so time is running out.”
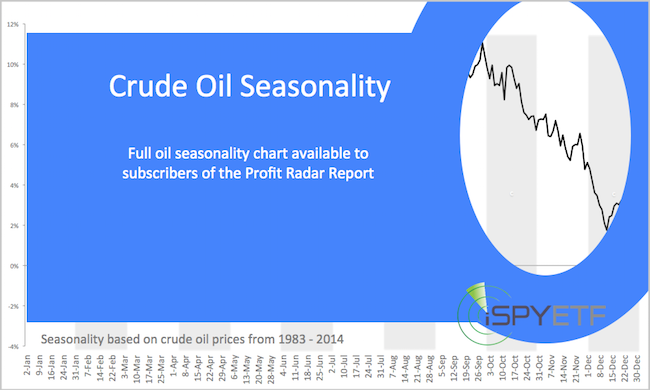
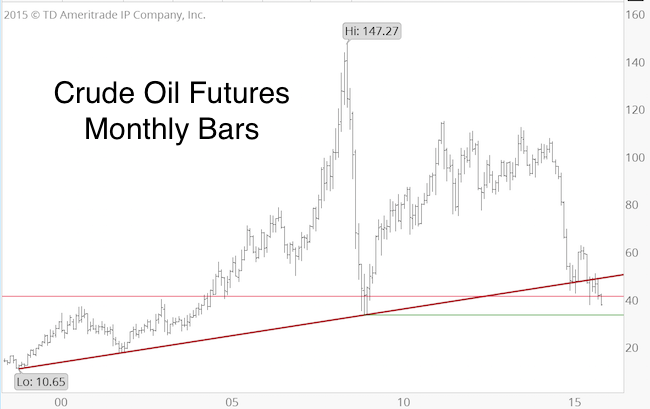
The November 15 Profit Radar Report, the last time we looked at oil, stated the following: “We sold crude oil (USO) near 48 in October citing strong bearish seasonality as reason. Oil has dropped 20% since, and seasonality continues bearish until mid-December. Technical support is between 40 and 33.”
Based on technical analysis, oil is now in the general support area likely to spark a bounce eventually.
Seasonality is turning gradually bullish in mid-December, but the big seasonal buy signal won’t occur until next year.
Seasonality is not always correct, but betting against an obvious seasonal pattern (such as oil's September – December rut) is like booking a Caribbean vacation during hurricane season.
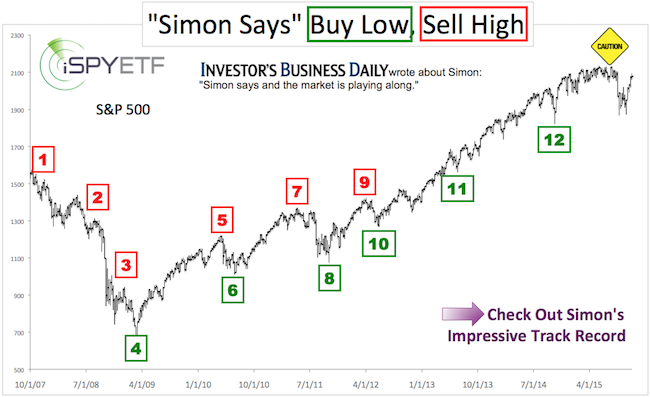
Simon Maierhofer is the publisher of the Profit Radar Report. The Profit Radar Report presents complex market analysis (S&P 500, Dow Jones, gold, silver, euro and bonds) in an easy format. Technical analysis, sentiment indicators, seasonal patterns and common sense are all wrapped up into two or more easy-to-read weekly updates. All Profit Radar Report recommendations resulted in a 59.51% net gain in 2013 and 17.59% in 2014.
Follow Simon on Twitter @ iSPYETF or sign up for the FREE iSPYETF Newsletter to get actionable ETF trade ideas delivered for free.
If you enjoy quality, hand-crafted research, >> Sign up for the FREE iSPYETF Newsletter
|
