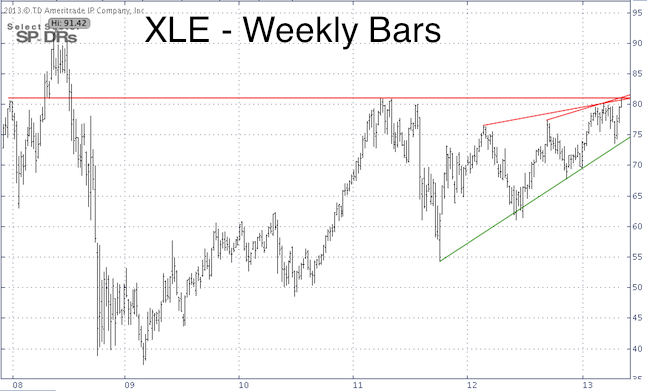
Although the energy sector is up 13% already year-to-date, it has been lagging behind many industry sectors. The Energy Select Sector SPDR ETF (XLE) is now butting up against important resistance.
Does XLE have enough fuel to bust through resistance or will it fool investors? In other words, will XLE fuel or fool portfolios?
The weekly XLE chart shows prices at cross roads. After three consecutive up weeks, XLE is pausing at the triple resistance cluster around 80.50 – 81.50.
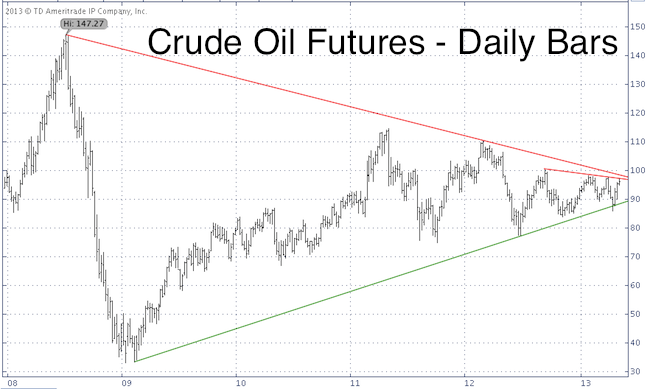
The performance of the energy sector sports a close correlation to the price of oil, so what are oil prices up to?
Unlike XLE, crude oil futures have not been able to climb to new recovery highs, but similar to XLE, crude oil is bumping against double trend line resistance around 97 – 98.50.
How to Profit with Resistance Levels
Resistance levels, like a dam contain prices … until broken. Depending on the overall technical picture, investors may go short against resistance or buy once resistance is broken.
Following a strong 3-week run into resistance, XLE and crude oil may need to take a breather before advancing further. While this may result in lower prices, it doesn’t have to be bearish for the long-term picture.
Regardless of the exact route, a break above resistance would be a buy signal. Broken resistance will then turn into support and support should be used as stop-loss level.
The ETF SPY provides FREE weekly trade set ups. >> Sign up for the free newsletter to get future ETF SPY ideas.
|
