|
|
| VIX and S&P 500 Sport Bearish (for S&P) Divergence |
| By, Simon Maierhofer
|
| Monday March 24, 2014 |
|
|
|
|
| Some things are just supposed to be opposites: Night or day, black or white, wet or dry, hot or cold. Here’s another one: S&P 500 and VIX. When the S&P goes up, the VIX is supposed to go down, but not lately. Something’s gotta give? |
|
The VIX (Chicago Options: ^VIX) generally moves in the opposite direction as the S&P 500 (SNP: ^GSPC).
However, since mid-February the VIX and S&P 500 have been moving higher concurrently. This is unusual and something’s gotta give.
Either the VIX or the S&P 500 will have to break down. Which one will it be?
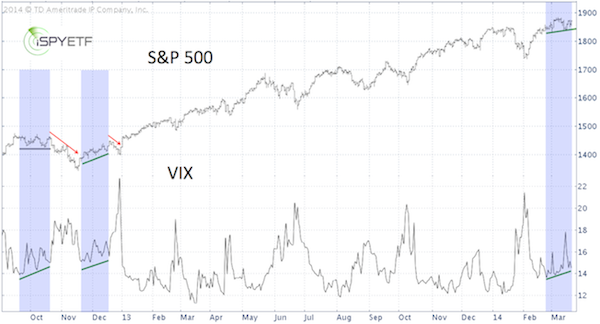
The March 20 Profit Radar Report featured the chart above along with the following observation:
“There were only two recent instances where the S&P and VIX moved higher concurrently for longer than a week or two. Both led to a small decline followed by a resumption of the rally.”
Today’s dip is a step towards restoring the historic correlation between the VIX and S&P.
Another piece of analysis – in fact, this is probably the most rudimentary approach to price analysis – also suggests a bit more pain ahead for stocks.
More details here: The Most Basic S&P 500 Indicator Turns ‘Red’
Simon Maierhofer is the publisher of the Profit Radar Report. The Profit Radar Report presents complex market analysis (S&P 500, Dow Jones, gold, silver, euro and bonds) in an easy format. Technical analysis, sentiment indicators, seasonal patterns and common sense are all wrapped up into two or more easy-to-read weekly updates. All Profit Radar Report recommendations resulted in a 59.51% net gain in 2013.
Follow Simon on Twitter @ iSPYETF or sign up for the FREE iSPYETF Newsletter to get actionable ETF trade ideas delivered for free.

|
|
|
|
|
|
|
|
|
|
|
|
|
|
