When complacency reigns, investors get wet or at least so goes the saying. The CBOE Volatility Index (VIX) has been trading below 15 for all of 2013, but the only ones getting ‘wet’ are VIX bulls and stock bears.
Still, the VIX is at a 73-month low and eventually there’s some money to be made buying VIX calls or long VIX ETFs. When will that be? VIX seasonality provides some clues.
VIX Seasonality
The first chart provides a visual of VIX seasonality based on data from 1990 – 2012. A devisor has been used to equally weigh each years’ performance.
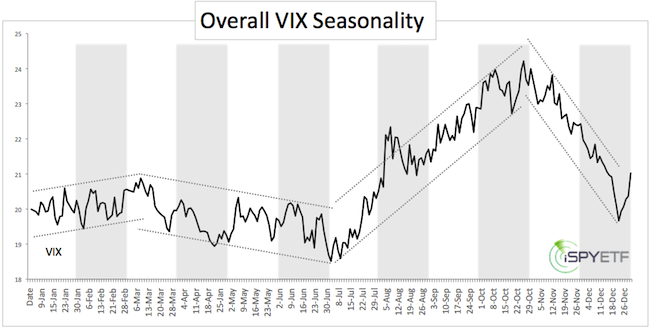
In an average year, the VIX has seasonal lows in early and late February before spiking to an early March high. This would provide a short window for a seasonal move higher.
The average February to March VIX spike is less than 10%. Obviously, there’s more potential upside in 2013 as the debt and deficit ceiling quandary has the potential to springboard the VIX from its 73-month low.
However, the VIX seasonality chart suggests to eat your ice cream before it melts. In other words, locking in any gains (or carefully managing any gains) before the early-March seasonal high is prudent.
S&P 500 Seasonality
Most of the time there’s an inverse correlation between the VIX and the S&P 500. When the VIX goes down, stocks go up and vice versa.
Does S&P 500 seasonality confirm VIX seasonality? It would in a perfect world, but investing is about odds, not perfection.
The second chart plots overall S&P seasonality (1950 – 2012) and post election year seasonality against VIX seasonality. VIX seasonality (blue line) is inverted for easier comparison of trends.
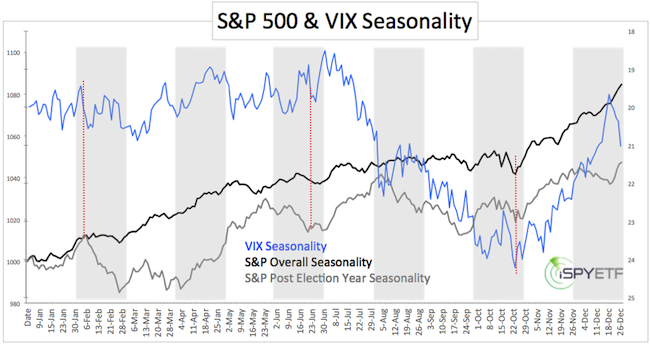
The dashed red lines mark three trends that line up. One is a mild early-to mid February sell signal (sell signal for stocks, not VIX) followed by a weak late June buy signal and a strong October buy signal.
S&P seasonality also suggests that any February correction may be short-lived.
Seasonality charts capture the general trends of more than six decades and averaging of trends eliminates a lot of ‘seasonal noise’ along with potential setups.
Nevertheless, when seasonality agrees with other indicators (like sentiment, technicals, fundamentals) we get a stronger signal. This could be the case right now.
Long VIX ETPs include the iPath S&P 500 Short-Term Futures ETN (VXX) and VelocityShares Daily 2x VIX Short Term ETN (TVIX).
Short S&P 500 ETFs include the Short S&P 500 ProShares (SH) and UltraShort S&P 500 ProShares (SDS).
|
