After many months of complacency the VIX (Chicago Options: ^VIX) has sprung back to life.
In fact, seasonality and technicals suggest that the VIX (NYSEArca: VXX) is near a key inflection point.
An absolutely unique tool available only to iSPYETF readers is the VIX seasonality chart.
The VIX seasonality chart is created from averaging together 23 years of VIX behavior. But since the VIX is at a different price level every year, using an average of the VIX’s actual values would inappropriately skew the result by overweighting the years when it was at a higher level and vice versa.
To equally weigh every year, the price history is adjusted (using a divisor) to begin at the same level on the first trading day of every year. Then each day's values for the rest of the year reflect the percentage change from that first day of the year.
The chart below shows VIX seasonality compared to this year’s VIX performance.
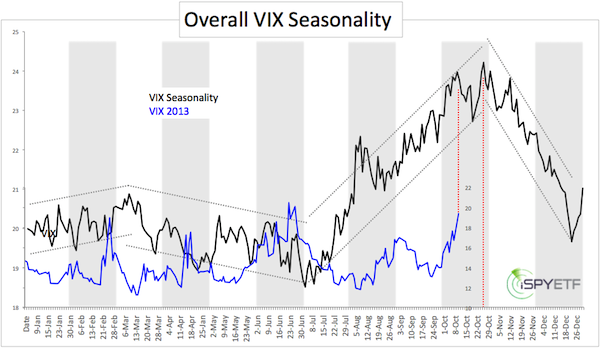
The VIX has been dancing to the beat of its own drum for much of the year, but the latest 60%+ VIX spike follows the seasonal pattern nicely.
Seasonality projects a minor VIX high around October 9 and a major VIX high in late October.
Of course this is important for stock investors as VIX movements have a direct effect on the S&P 500 (NYSEArca: SPY), Nasdaq (Nasdaq: QQQ) and other major indexes.
But seasonality is not the only force driving the VIX.
In fact, here’s an interest development unrelated to seasonality: Since September 19, the S&P 500 (SNP: ^GSPC) lost about 4%, yet the VIX soared 63%.
This 63% spike pushed the VIX above a 5-year old resistance level. Normally a move above such important resistance is bullish. Bullish for VIX means bearish for stocks.
What about this time? Will the VIX continue to rally, pushing stocks lower? Here’s a detailed look at the VIX from a technical analysis perspective. VIX Above 5-Year Resistance - What Does it Mean?
Simon Maierhofer is the publisher of the Profit Radar Report. The Profit Radar Report presents complex market analysis (stocks, gold, silver, euro and bonds) in an easy format. Technical analysis, sentiment indicators, seasonal patterns and common sense are all wrapped up into two or more easy-to-read weekly updates. We are accountable for our work, because we track every recommendation (see track record below).
Follow Simon on Twitter @ iSPYETF or sign up for the FREE iSPYETF Newsletter to get actionable ETF trade ideas delivered for free.

|
