Fear is back for the first time since June, when the S&P 500 (SNP: ^GSPC) dropped 127 points and the VIX (Chicago Options: ^VIX) soared as much as 78%.
This time around, the S&P 500 (NYSEArca: SPY) has only dropped 68 points, but the VIX (NYSEArca: VXX) is already up 63% (since September 19).
In other words, investors are more shaken up by the 68-point post September drop than the 127-point June drop. What does this mean?
There are two possible interpretations:
1) The VIX is already overbought and ripe to move lower. (or)
2) As the chart below shows, the VIX just broke out above two trend lines, one going back to October 2011, the other going all the way back to October 2008.
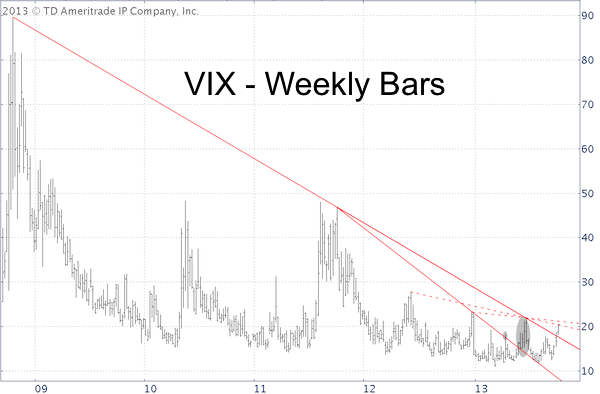
The large gray oval shows what happened the last time the VIX broke above a similar trend line in May 2013.
The dotted red lines mark near-term resistance for the VIX.
Based on the May breakout pattern there is more up side for the VIX (NYSEArca: TVIX), but to unlock this up side potential the VIX needs to move above near-term resistance first.
Perhaps more insightful than the VIX chart at this point is VIX seasonality. The VIX is about to hit the most important turning point of the season.
VIX seasonality is discussed here: VIX Seasonality Near Best Turning Point of the Year
|