At the beginning of every year I put together a full year S&P 500 forecast.
Without beating around the bush, here is the essence of my 2014 S&P 500 forecast, wrapped up in one chart. The 2014 forecast was published on January 15, 2014 (full forecast available to subscribers of the Profit Radar Report):
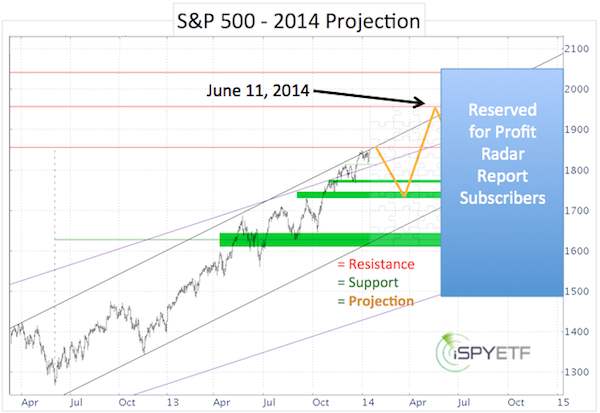
The yellow line is the expected path of the S&P 500 (SNP: ^GSPC). This projection is based on, what I call, the “3 pillars of market forecasting.”
-
Technical analysis
-
Sentiment
-
Seasonalities & Cycles
The 2014 S&P 500 forecast includes a detailed analysis of each of the three ‘pillars.’ Condensing the most pertinent data points into a few yellow lines resulted in the chart shown above.
What are the raw data points? Here are the data corner stones listed in the ‘Summary’ section of the 2014 S&P 500 Forecast:
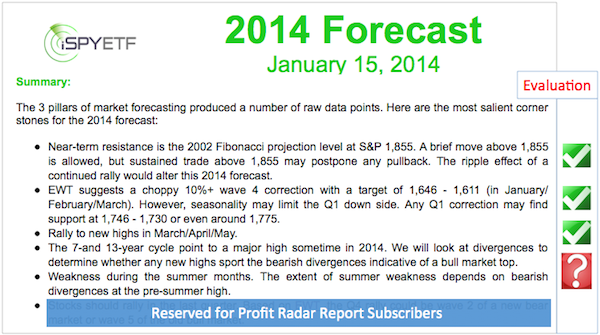
As per the third bullet point, we expected the S&P 500 to: “Rally to new highs in March/April/May,” and form some sort of top.
The chart below plots the S&P’s actual performance against my January projection. The timing was a bit off, but in terms of shape, the S&P mirrored the forecast rather closely.
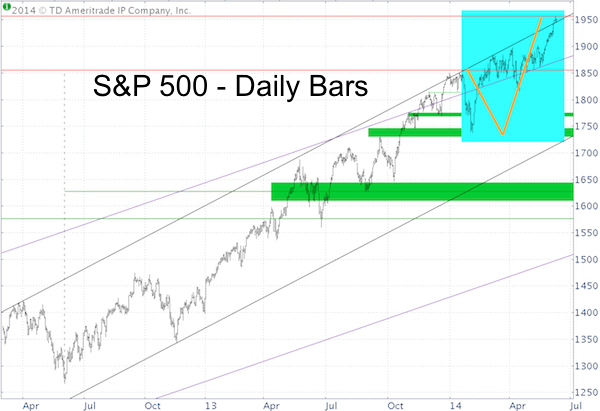
Although the 2014 forecast proposed a May correction, extremely bearish forecasts published by the financial media in late April and throughout May prolonged the most recent rally leg. The May 11 Profit Radar Report stated the following:
“Our carefully crafted 2014 outlook (which called for a May correction) has become the crowded trade. How will the market fool the crowded trade? The chart detective inside of me favors a pop to 1,915. Historic price patterns suggest a breakout to the up side with the possibility of an extended move higher.”
The S&P easily surpassed 1,915 and the June rally carried the S&P 500 (NYSEArca: SPY) to confluence of resistance around 1,950. My 2014 forecast marks 1,950 as a key resistance for a potential high.
What are the odds of the S&P 500 reversing course here? Could this be a major market top?
These and other questions were answered in recent Profit Radar Report updates. Sign up here for a 30-day money back guarantee trial.
Simon Maierhofer is the publisher of the Profit Radar Report. The Profit Radar Report presents complex market analysis (S&P 500, Dow Jones, gold, silver, euro and bonds) in an easy format. Technical analysis, sentiment indicators, seasonal patterns and common sense are all wrapped up into two or more easy-to-read weekly updates. All Profit Radar Report recommendations resulted in a 59.51% net gain in 2013.
Follow Simon on Twitter @ iSPYETF or sign up for the FREE iSPYETF Newsletter to get actionable ETF trade ideas delivered for free.

|
