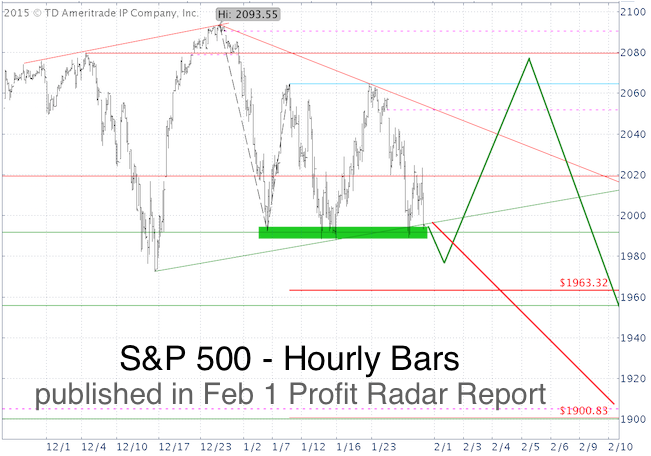
How quickly things change. Here’s the chart and forecast that now requires a full reevaluation:
February 1 Profit Radar Report: “Near-term support around 1,990 is becoming quite obvious. When support is too obvious, the market may want to fool investors with a seesaw. A drop below 1,990 followed by a reversal and rally towards 2,080 (green projection in chart below) is most likely” (the alternate red projection would only have come into play with sustained trade below 1,990).
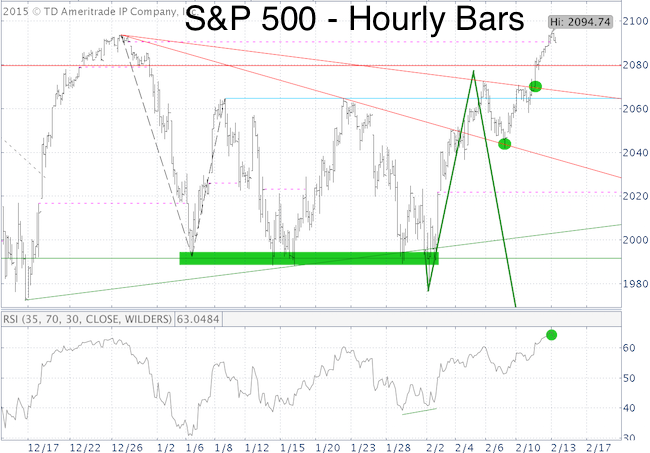
The S&P briefly dropped below 1,990 and rallied to 2,080 … and beyond. In fact, there was a new all-time S&P 500 (NYSEArca: SPY) high today.
The new all-time high is in harmony with the longer-term forecast of the January 4 Profit Radar Report: “Based on the ‘secret sauce indicator’, we expect new all-time highs following correction lows” (for the benefit of paying subscribers, I replaced the name of the actual indicator with ‘secret sauce.’ More details about the reliable ‘secret sauce indicator’ is available here).
However, as implied by the original green projection, I expected the S&P 500 to roll over around 2,080 and drop below 1,980.9 (February 2 low) at the minimum. In fact, I would have preferred to see 1,900 for a great buying opportunity.
Obviously the S&P 500 did not roll over around 2,080, but do I still expect new lows?
Looking for more continuous S&P 500 analysis? >> Sign up for the FREE iSPYETF e-Newsletter
New Lows?
Below is an updated version of the February 1 chart. The green circles mark bullish touch points. There were other telltale signs along the way hinting at more immediate bullish potential.
The February 6 article - Will New MidCap Highs Propel All Stocks Higher? - noted the new SPDR MidCap ETF (NYSEArca: MDY) all-time highs, the S&P 500 trend line breakout and solid internal market breadth.
The warning given was that: “There’s no room for tunnel vision. Dale Carnegie beautifully illustrated the cost of tunnel vision: ‘Here lies the body of William J., who died maintaining his right away. He was right, dead right as he sped along, but he's just as dead as if he were wrong. Nobody wants to be William J.”
There was also the Nasdaq QQQ ETF (Nasdaq: QQQ) breakout (February 10: Can the Nasdaq QQQ ETF Break out of a Bull Flag Pattern and Rally 10%?).
Will this be Another Extended Rally?
Some short-term indicators are overbought, but RSI confirmed the recent high and the new S&P all-time high is greeted with headlines such as:
-
Robert Shiller’s (depressing) advice for investors – CNBC
-
7 danger signs of stocks’ coming bear market – MarketWatch
That's not the kind of optimism indicative of a major top.
The new ATH essentially eliminates the immediate risk of new lows (below 1,980.9). A smaller correction is still possible, but the overall environment is changing towards ‘buy the dip’ … for now.
Continued updates are available via the Profit Radar Report.
Simon Maierhofer is the publisher of the Profit Radar Report. The Profit Radar Report presents complex market analysis (S&P 500, Dow Jones, gold, silver, euro and bonds) in an easy format. Technical analysis, sentiment indicators, seasonal patterns and common sense are all wrapped up into two or more easy-to-read weekly updates. All Profit Radar Report recommendations resulted in a 59.51% net gain in 2013 and 17.59% in 2014.
Follow Simon on Twitter @ iSPYETF or sign up for the FREE iSPYETF Newsletter to get actionable ETF trade ideas delivered for free.

|
