|
|
| Under the Hood is more Strength than the S&P 500 Chart Shows |
| By, Simon Maierhofer
|
| Tuesday April 21, 2015 |
|
|
|
|
| Although the S&P 500 failed to overcome resistance and reach new highs, a ‘look under the hood’ shows that buying pressure is actually stronger than it appears. Here’s what that’s good and bad news. |
|
If you own stocks, this is a good new / bad news scenario.
On one hand, U.S. stocks are stronger than the S&P 500 (NYSEArca: SPY) chart suggests. On the other hand, stocks are (or were) overbought, at least based on this indicator.
Here are the details:
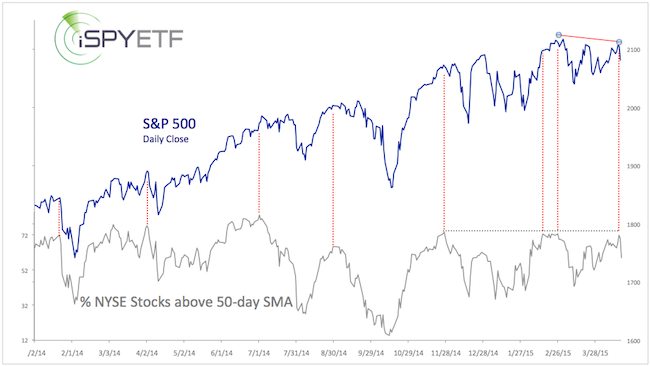
The percentage of NYSE stocks above their 50-day SMA nearly matched their previous highs last week, while the S&P 500 stayed below its prior highs.
Never Miss a Beat! >> Sign up for the FREE iSPYETF e-Newsletter
The potential implications are two-fold:
-
The buying pressure behind the latest rally leg is actually stronger than the S&P 500 chart suggests.
-
The % of NYSE stocks above their 50-day SMA reached an overbought reading. Prior such instances either saw stocks struggle to move higher or correct.
Technical analysis allows us to identify a key level that serves as line in the sand. Trade above means higher prices, and vice versa. Why this level is crucial is explained here.
Simon Maierhofer is the publisher of the Profit Radar Report. The Profit Radar Report presents complex market analysis (S&P 500, Dow Jones, gold, silver, euro and bonds) in an easy format. Technical analysis, sentiment indicators, seasonal patterns and common sense are all wrapped up into two or more easy-to-read weekly updates. All Profit Radar Report recommendations resulted in a 59.51% net gain in 2013 and 17.59% in 2014.
Follow Simon on Twitter @ iSPYETF or sign up for the FREE iSPYETF Newsletter to get actionable ETF trade ideas delivered for free.

Never Miss a Beat! >> Sign up for the FREE iSPYETF e-Newsletter
|
|
|
|
|
|
|
|
|
|
|
|
|
|
