We looked at various sentiment measures in April and May, and the common denominator was that investors were unusually bearish.
As happens so often, bearish sentiment turned into bullish price action (for an insightful read on foolishly bearish forecasts click here: Hey Bears! Where is the Promised Crash or Correction?).
Thanks to the cycle of sentiment mean reversion, rising prices (since late May) lifted bullish sentiment. In fact, two sentiment measures reached multi-year extremes this week.
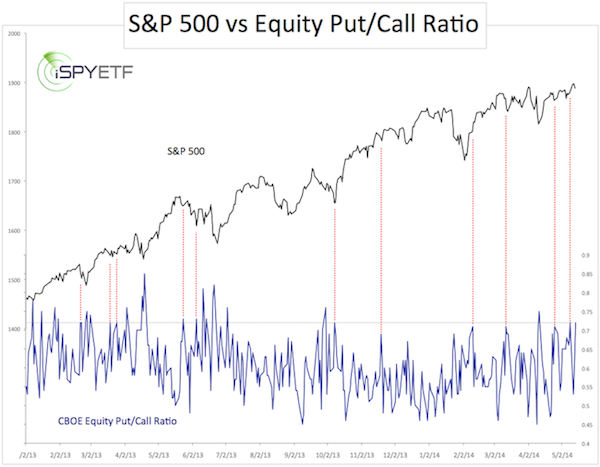
One particular gauge that foreshadowed a stock market rally back in May was the CBOE Equity Put/Call Ratio.
The May 14 and 18 Profit Radar Report featured this chart of the equity put/call ratio and stated: “Prior corrections were preceded by a put/call ratio around 0.5 or below. Today the put/call ratio is at 0.72, a level that’s indicative of a low more than a top. The equity put/call ratio cautions of further up side.”
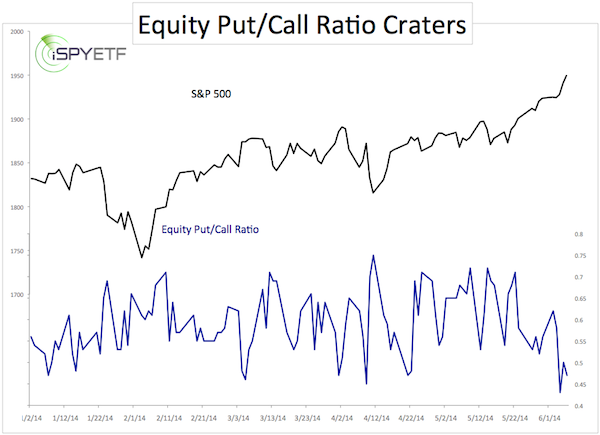
The second chart updates the equity put/call ratio and plots it against the S&P 500. On Wednesday the equity put/call ratio dropped to 0.43, the lowest reading sine January 2011 (chart updated 6/6/14 at 6:30pm PST). The 5-day put/call ratio SMA fell to 0.52, the lowest reading of 2014.
In addition, the percentage of bullish investment advisors polled by Investors Intelligence rose to 62.2%, the second highest level in the survey’s history.
Readings above 60% generally result in a rally pause or correction. However, the survey’s all-time high water mark (62.9%) occurred in December 2004 and didn’t cause too much trouble.
The equity put/call ratio is more worrisome as it indicates very limited hedging activity. This means many investors are long and naked (long without put protection). If the S&P 500 (NYSEArca: VOO) starts falling, they have to sell their core holding.
I always look at more than just two sentiment gauges. A broadening of the sentiment scope reveals that other gauges are still in neutral territory (retail sentiment, CBOE SKEW Index, etc.).
Once a month, the Profit Radar Report publishes a comprehensive sentiment picture that plots six sentiment gauges against the S&P 500. The May 23 Sentiment Picture proposed that: “The market will grind or spike higher (whichever is necessary to turn more investors into bulls) before delivering a noteworthy correction.”
Clearly the S&P 500 (NYSEArca: SPY) has succeeded in turning many more investors into bulls. Whether it’s been enough to cause a correction remains to be seen, but risk is rising.
Of course a discussion about sentiment extremes wouldn't be complete without mentioning an 88-month low for the VIX (Chicago Options: ^VIX). How much lower can the VIX go? Believe it or not, this may not be the right question to ask. Here's why:
VIX at 88-Month Low - How Much Lower Can it Go?
Simon Maierhofer is the publisher of the Profit Radar Report. The Profit Radar Report presents complex market analysis (S&P 500, Dow Jones, gold, silver, euro and bonds) in an easy format. Technical analysis, sentiment indicators, seasonal patterns and common sense are all wrapped up into two or more easy-to-read weekly updates. All Profit Radar Report recommendations resulted in a 59.51% net gain in 2013.
Follow Simon on Twitter @ iSPYETF or sign up for the FREE iSPYETF Newsletter to get actionable ETF trade ideas delivered for free.

|
