U.S. stocks do not trade in a vacuum; they are part of an intricate ‘ecosystem’ of worldwide financial markets.
As with any ecosystem, financial markets adhere to the ‘cause and effect’ principle.
Just like there’s a correlation between birds of prey and the mice population or bees and pollination, there are correlations between specific financial markets (some are directly correlated, others are inversely correlated).
Understanding market correlations/connections can be helpful in forecasting stock market movements.
Some of those financial ecosystem correlations are:
-
U.S. stocks (or S&P 500) and the Japanese yen
-
U.S. stocks (or S&P 500) and U.S. Treasuries
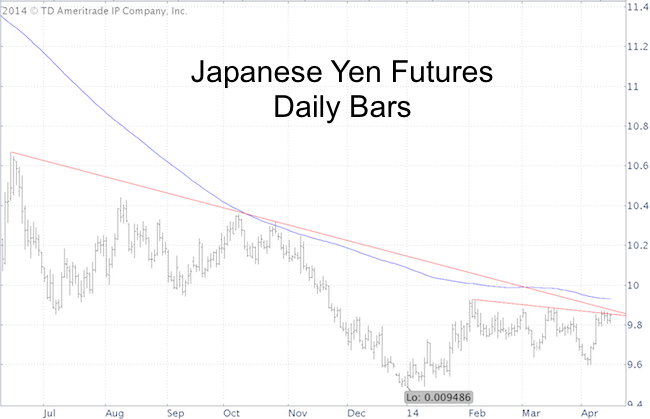
S&P 500 vs Japanese Yen
Due to the carry trade, the yen has become an important force for the S&P 500.
As part of the yen carry trade, U.S. investors borrow yen to buy U.S. stocks. The yen can be borrowed cheaply and U.S. stocks have delivered juicy returns in recent years.
Courtesy of Japan’s Prime Minister Shinzo Abe, a falling yen makes paying back the yen even cheaper and has made the carry trade even more attractive.
A rising yen would have the opposite effect on U.S. stocks.
The Japanese Yen Futures chart below shows the yen butting against double trend line resistance and the 200-day SMA.
S&P 500 vs 30-Year Treasuries
Bond investors have a reputation to be smarter than stock investors. I like to monitor 30-year Treasury bond prices as they tend to have an inverse correlation to the S&P 500 (SNP: ^GSPC).
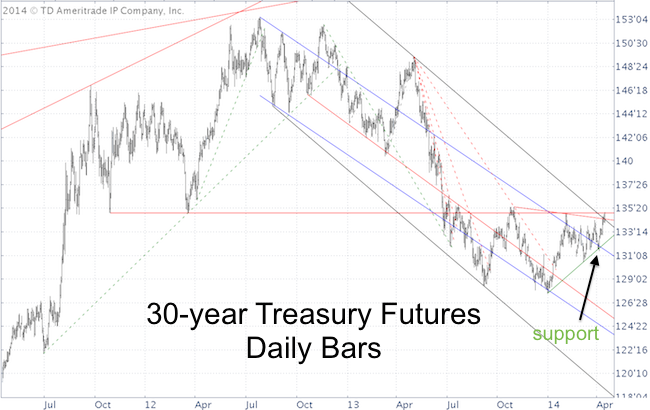
On April 2, 30-year Treasury prices found support at the green trend line. The April 2 Profit Radar Report stated that: "30-year Treasuries have reached near-term support. Prices tend to respond to such trend lines, so a bounce is possible. A bounce for Treasuries would provide headwinds for higher stock prices."
30-year Treasury Futures bounced from support and now trade above double trend line resistance. This bullish breakout (assuming it sticks), suggests lower prices for U.S. stocks.
Although those charts don’t tell us the up side potential for the yen and Treasuries (or down side risk for the S&P 500), they do tell us that we are at a pivotal point in time.
The S&P 500 (NYSEArca: SPY) chart confirms the message of yen and Treasuries and provides clear ‘points of ruin’ or must hold support levels.
Here is the most important near-term support level:
Don’t Get Fooled by This S&P 500 Bounce
Simon Maierhofer is the publisher of the Profit Radar Report. The Profit Radar Report presents complex market analysis (S&P 500, Dow Jones, gold, silver, euro and bonds) in an easy format. Technical analysis, sentiment indicators, seasonal patterns and common sense are all wrapped up into two or more easy-to-read weekly updates. All Profit Radar Report recommendations resulted in a 59.51% net gain in 2013.
Follow Simon on Twitter @ iSPYETF or sign up for the FREE iSPYETF Newsletter to get actionable ETF trade ideas delivered for free.

|
