Chart gaps are one of the most rudimentary and most effective S&P 500 forecasting tool.
What is a Chart Gap?
A chart gap is a price level where no trading occurred. It occurs when price makes a sharp move up or down, leaving a gap.
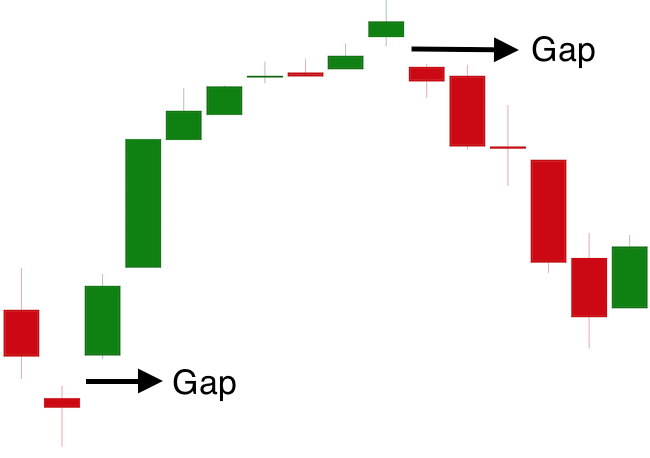
Most gaps (at least for stock indexes) occur in the morning. The often reflect underlying strength and at times a temporary change of trend.
How to Use Gaps
Gaps often mark temporary trend changes, but more often they represent ‘unfinished business.’
They are a blank or void on the chart and for whatever reason stock indexes (in particular the S&P 500) almost always fill open gaps eventually. Gaps act like magnets.
Here is where gaps have been most helpful in recent years: We've seen a number of shallow pullbacks in 2013 and 2014, and every time stocks dropped by a few percent, investors thought the bull market is over.
Many times however, the S&P 500 (NYSEArca: SPY) started the correction with a chart gap, indicating price will eventually (most times it was sooner rather than later) come back to close the gap.
With an open gap, the S&P 500 basically just dropped its poker face and offered a glimpse in its card. The message: “I’m just bluffing. Don’t worry about the correction, there will be new all-time highs.”
This chart shows some of the more obvious chart gaps and the corresponding comments by the Profit Radar Report.
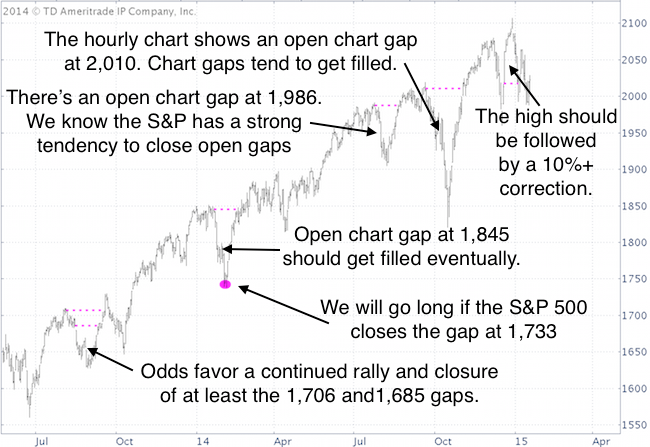
Chart gaps (along with another indicator I call ‘secret sauce’) told us that pretty much every correction since mid-2013 will be reversed and followed by new all-time highs.
Currently there are two open chart gaps that merit our attention. One quite a bit below and another quite a bit above current trade.
I expect both gaps to be filled. The Profit Radar Report shows in which sequence.
Simon Maierhofer is the publisher of the Profit Radar Report. The Profit Radar Report presents complex market analysis (S&P 500, Dow Jones, gold, silver, euro and bonds) in an easy format. Technical analysis, sentiment indicators, seasonal patterns and common sense are all wrapped up into two or more easy-to-read weekly updates. All Profit Radar Report recommendations resulted in a 59.51% net gain in 2013.
Follow Simon on Twitter @ iSPYETF or sign up for the FREE iSPYETF Newsletter to get actionable ETF trade ideas delivered for free.

|
