Technical analysis is not infallible, but sometimes it allows you to pinpoint key inflection areas.
The Financial Select Sector SPDR ETF (NYSEArca: XLF) is at such a key inflection point right now.
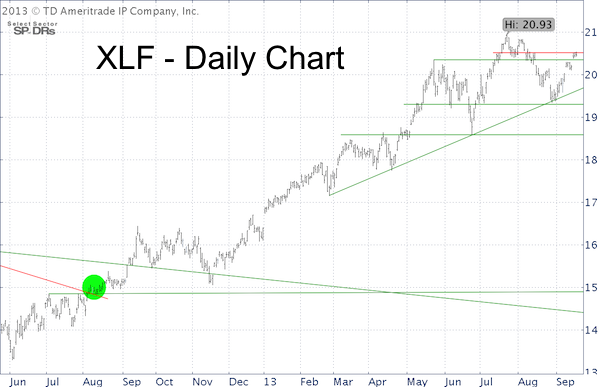
The XLF chart below offers a wealth of information (updated on 9-18-2013):
1) XLF surpassed the May 2013 highs (now support).
2) XLF is still below the July 15, August 15 highs (red lines), the next resistance.
3) The current rally high could almost be considered the right shoulder of a head-and shoulders top (although there's no real neckline).
4) Key resistance is around 20.60.
5) Key support is at 19.50 and 19.30.
6) There is a bearish RSI divergence at the July 23 high.
What Does All This Mean?
As long as trade stays below 20.60, the path of least resistance is down. However, the persistence of the latest rally suggests that resistance may be overcome (persistence wears down resistance).
How to Trade
There are two low-risk ways to trade XLF:
1) Go short now with a stop-loss above resistance or
2) Go short once support is broken or
3) Go long once resistance is broken (I wouldn't go long as the immediate up side seems limited).
Those are low-risk trades, not no risk trades.
Why Low Risk
Support/resistance levels act like traffic lights. A car driving down the street is most likely to stop (and reverse) at a traffic light. It doesn’t have to, but if the light is red it has to stop.
The XLF resistance level acts like a traffic light. XLF doesn’t have to stop there (in fact, a bullish case can be made if XLF breaks above resistance), but if XLF is going to stop and reverse, it will be at this ‘light.’
Overhead XLF resistance provides a stop-loss level, which exactly defines the risk of the trade. The potential gain is significantly larger than the potential loss, putting the risk reward ratio in favor of the short trade.
Only trading low-risk setups like this one results in about 60% winning trades, but the gains of the winning trades are 3-4 times bigger than the losses of the losing trades. The Profit Radar Report specializes in spotting such trade setups. The green bubble (August 5, 2012), marks when the Profit Radar Report stated: "Financials are currently underloved. With such negative sentiment, a breakout above 14.90 could cause a quick spike in prices."
XLF echoes the current position of the S&P 500 (NYSEArca: SPY), which trades at a similar inflection point. The Nasdaq (Nasdaq: QQQ) has rallied much further than the S&P 500, the Dow Jones on the other hand (NYSEArca: DIA) has yet to catch up to the S&P 500.
Regardless of the short-term outlook for XLF, the financial sector is still plagued by serious issues.
Out of all people, it’s Hank Paulson – former Treasury Secretary (during the 2008 financial crisis) – and the Federal Reserve who are addressing the vulnerability of the financial sector. Paulson warns of another financial ‘firestorm’ and the Federal Reserve preemptively implies that QE will not be at fault for a meltdown.
More details here: Hank Paulson Warns of Another Financial Crisis
Surprising New Fed Study - Is it Preparing Americans for a Market Crash?
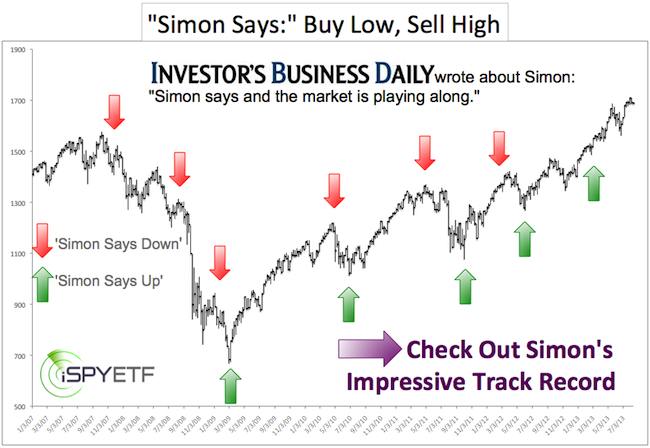
Simon Maierhofer is the publisher of the Profit Radar Report.
Follow Simon on Twitter or sign up for the Free Newsletter.
|
