The S&P is trading today where it was on May 22. In other words, no net progress in 2 ½ months.
For the last 30 days the S&P 500 has been stuck in a 37-point trading range.
Investing and trading is about knowing when to buy, sell and simply do nothing. Previously back on July 17, the Profit Radar Report said that: “the immediate down side is limited, the up side is limited as well.”
Sitting on the sideline doesn’t make you money, but it doesn’t lose you money either. Furthermore, not expecting any big moves allows you to wait without being on the edge about missing the next big move.
Like a fisherman waiting for the next big catch, investors and traders are waiting for the next big move. It may take patience, but the next big move always comes and nobody wants to miss it.
Key support helps identify the next big move, because once support is broken, prices generally move to the down side.
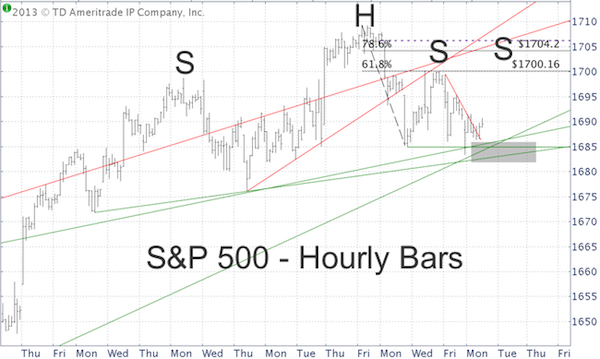
The 1-hour S&P 500 (SNP: ^GSPC) chart below reveals important support created by all the seemingly aimless churning of 20+ long trading days.
There is a trend line convergence in the low 1,680s along with the neckline of a possible head-and shoulders pattern.
There is also an open chart gap at 1,706. Chart gaps have been acting like a magnet for the S&P 500 (NYSEArca: SPY) and Nasdaq-100 (NYSEArca: QQQ). Fibonacci resistance is at 1,700 and 1,704 (could ultimately be trumped by the open chart gap).

I’m not ashamed to admit that I don’t know where the next short-term move will take stocks. In fact, in my Profit Radar Report I’ve declared 1,684 – 1,709 a trade-neutral zone.
But, a drop below the support cluster and head-and shoulders trend line should unlock a move to about 1,650 with more bearish potential thereafter.
What about the up side? The S&P 500 (NYSEArca: IVV) hasn’t hit our up side target yet, so new highs (now or after a correction) are still possible. Regardless, the up side is limited and becoming more and more risky.
Key support is even more important as the Hindenburg Omen just reared its ugly head. The Omen has had many misfires, but a reexamination of past signals shows that this one might actually be for real. In fact, this analytical tweak may restore the Omen's bruised image. Here's a closer look at why it shouldn't be ignored this time: The Hindenburg Omen is Back - Will it Stick This Time?
Simon Maierhofer is the publisher of the Profit Radar Report.
Follow Simon on Twitter @ iSPYETF or sign up for his FREE newsletter.

|