Stocks are at near all-time highs. That’s good news, but not Guinness Book worthy.
What’s starting to become noteworthy is that the last 186-point S&P 500 rally since early September has accomplished what the previous 634-point S&P 500 rally couldn’t – Tantalize and excite investors.
The chart below plots the S&P 500 (SNP: ^GSPC) against the percentage of bullish advisors polled by Investors Intelligence (II).
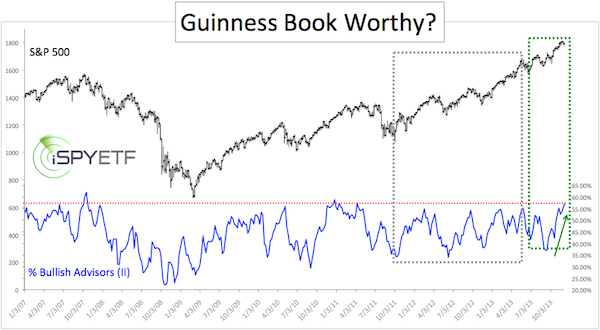
The gray box illustrates that the 634-point rally from October 2011 to August 2013 didn’t get investors as excited as the 186-point rally that sprung from the September low (green box).
Are investors really Guinness Book worthy enthused about stocks? Yes!
Here are some stunning facts (feel free to use them as trivia):
4 Stunning Sentiment Records
-
Based on one mutual fund company’s data (Rydex), investors now have $21 invested in Nasdaq-100 (Nasdaq: QQQ) leveraged long funds for every $1 invested in the Nasdaq-100 leveraged short fund. An all-time high.
-
There are now $3.7 invested in equity mutual funds and ETFs for every $1 invested in money market funds. A 30+ year record.
-
The percentage of bearish investment advisors polled by Investors Intelligence (II) has dropped to 14.3%. The lowest reading since late 1980.
-
Active investment managers polled by NAAIM are more exposed to stocks – like those in the S&P 500 and Nasdaq – today than at any other time since the survey started in 2006. Click here for detailed chart and analysis:
Wrong-footed? Active Investment Managers are Record Long
The Curveball
Imagine an auction, like one put on by Christie’s or Sotheby’s. At the beginning of the auction the room is full of buyers and they are ready to bid.
But what happens if the auction goes on too long, much money has already been spent and buyers are getting drowsy? The buying power shrinks and bids dry up.
That’s where the stock market is right now. Buyers have become owners of stocks. The only thing an owner can do is hold or sell.
In a normal market environment stocks would be very susceptive to a big drawdown.
But this isn’t a normal environment. The stock market has a permanent buyer that buys at every price – the Federal Reserve. Does this means stocks can’t go down?
Yes and no. I prefer to check actual money flows and gauges of real supply and demand for stocks (this demand includes buying by the Federal Reserve).
This indicator (it’s actually a duo of two indicators) has correctly foreshadowed this year’s May, August and September corrections, and has correctly indicated that every correction will be followed by new highs.
What’s it saying now? With sentiment extremes at all-time highs, it’s crucial to know whether any correction will be temporary or not.
A detailed look at this reliable set of indicators is provided here: What's Next? Minor Correction or Major Top?
Simon Maierhofer is the publisher of the Profit Radar Report. The Profit Radar Report uses technical analysis, dozens of investor sentiment gauges, seasonal patterns and a healthy portion of common sense to spot low-risk, high probability trades (see track record below).
Follow Simon on Twitter @ iSPYETF or sign up for the FREE iSPYETF Newsletter to get actionable ETF trade ideas delivered for free.

|
