‘Triple Witching’ (when stock options, stock index options and stock index futures expire) is often a turning point for stocks.
This was the case again this year. The March 21 Profit Radar Report pointed out that: “The S&P 500 closed lower on Triple Witching day 15 out of 21 years (71%). The week after Triple Witching ended with a loss 14 out of 21 years (66%).”
This statistic is based on the performance of the S&P 500 tracking ETF (NYSEArca: SPY) since its inception in 1993.
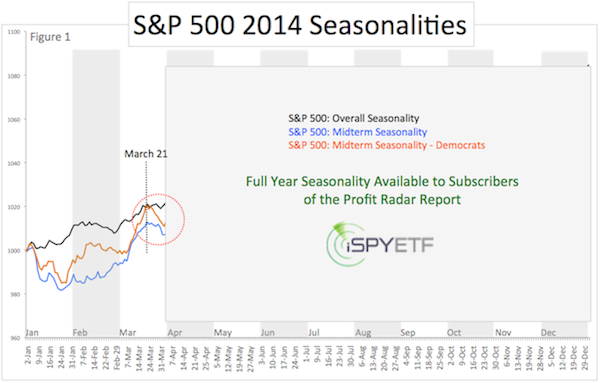
Looking at seasonality, based on the S&P 500 (SNP: ^GSPC) since 1950, paints the same picture.
The chart below shows S&P 500 seasonality based on:
-
Every year since 1950
-
Every midterm presidential election year since 1950
-
Every midterm year since 1950 with a democratic president
All three seasonalities show pronounced weakness in late March.
What’s in store for April?
A full 2014 seasonality calendar is available to subscribers of the Profit Radar Report, but here's a look at an index that sports a real unique telling pattern.
Russell 2000 Slices Below Support and Captures First Target
Simon Maierhofer is the publisher of the Profit Radar Report. The Profit Radar Report presents complex market analysis (S&P 500, Dow Jones, gold, silver, euro and bonds) in an easy format. Technical analysis, sentiment indicators, seasonal patterns and common sense are all wrapped up into two or more easy-to-read weekly updates. All Profit Radar Report recommendations resulted in a 59.51% net gain in 2013.
Follow Simon on Twitter @ iSPYETF or sign up for the FREE iSPYETF Newsletter to get actionable ETF trade ideas delivered for free.

|
