Driven by financials, the S&P 500 (SNP: ^GSPC) was the only major U.S. index to see a new high today. The Dow Jones, Nasdaq and Russell 2000 were unable to overcome their previous high watermarks.
Today’s lonesome S&P 500 all-time high (ATH) was a bull trap (at least for the short-term).
Reason enough to take a closer look at the S&P 500, in particular the SPDR S&P 500 ETF (NYSEArca: SPY).
The stock market has crushed some of the most commonly referred to tall tale signs.
How did gnarly Mr. Market fool much of Wall Street? (see chart for corresponding numbers)
1) January 23, 24 saw a high volume sell off below the 20-day SMA and the prior ATH. This was bearish (as technical analysis 101 suggests) and resulted in marginally lower prices.
2) On February 11, the S&P 500 rallied back above the 20-day SMA and prior support (now resistance) on much lower volume.
Basic volume analysis would have suggested that such an anemic move will sooner peter out, but a few weeks later the S&P traded 4% higher.
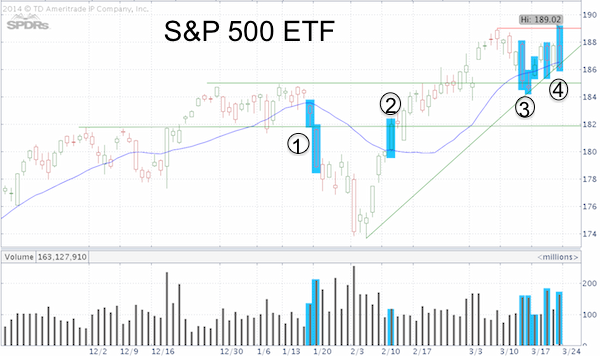
3) On March 13, 14 the S&P once again sliced below the 20-day SMA and the prior ATH on elevated trading volume. Like in January, textbook analysis would point to lower prices.
Since than, SPY has rallied on low volume and declined on high volume. This is normally bearish.
4) Today’s the S&P spiked to new ATH’s, by many considered a technical breakout.
But this didn’t last long. In fact, today’s selloff created an ominous red candle high.
In a special early morning update, the Profit Radar Report warned that:
“From a purely technical point of view, this morning’s intraday all-time high is bullish and suggests higher prices. However, there is at least one Elliott Wave count allowing for a fake out breakout, followed by a drop lower. Today is also Triple Witching. Stocks close lower on Triple Witching 71% of the time.”
The recommendation given by the Profit Radar Report was to go long only after a move above 1,885 for the S&P 500 (today’s high was 1,883.97).
What’s next?
The S&P 500 and SPY ETF found support at a trend line going back to February 5.
Unbeknownst to many, March Triple Witching also has a longer-term bearish seasonality. This may well draw stocks lower if support fails.
Historical Fact: March Triple Witching Sends S&P 500 Lower
Simon Maierhofer is the publisher of the Profit Radar Report. The Profit Radar Report presents complex market analysis (S&P 500, Dow Jones, gold, silver, euro and bonds) in an easy format. Technical analysis, sentiment indicators, seasonal patterns and common sense are all wrapped up into two or more easy-to-read weekly updates. All Profit Radar Report recommendations resulted in a 59.51% net gain in 2013.
Follow Simon on Twitter @ iSPYETF or sign up for the FREE iSPYETF Newsletter to get actionable ETF trade ideas delivered for free.

|
