The other day I stumbled upon this interesting piece of Dow Theory research by Bespoke Investment Group titled “Dow Theory Still Bullish.”

The bullish Dow Theory message was summarized as follows: “Many investors look for the Transports to lead the way, and the fact that it has done so well is a bullish sign for the major indices like the Dow and S&P 500, in our view.”
The analysis and the Dow Theory interpretation was not wrong per say, but the timing was terrible. The article was published on September 17, and followed by an 11% drop in the Dow Jones Transportation Average.
No indicator is perfect, but an outright bullish assessment or signal prior to a double-digit selloff is worth examining.
The chart below enhances the Dow Jones Industrial Average and Dow Jones Transportation average with a few simple trend lines.
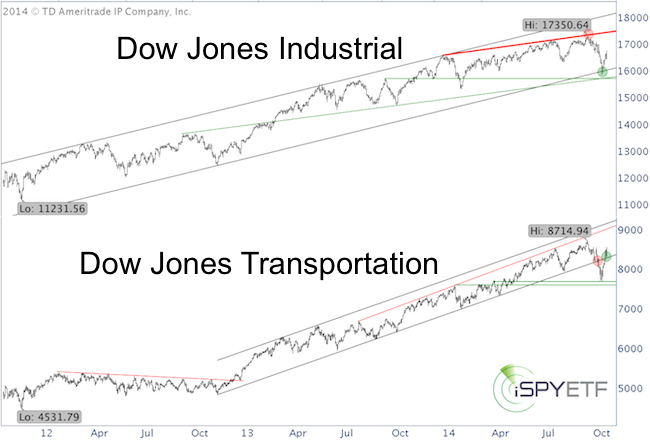
The bold red Dow Jones trend line resistance was my personal up side target (shared with subscribers to the Profit Radar Report) since late July. In fact, the September 17 Profit Radar Report warned that:
“The Dow and S&P are moving towards our targets and risk is rising.”
The ensuing selloff drew the Dow Jones Transportation Average well below a strong 2-year trend channel.
Although bearish, it wasn’t time to panic, because both averages confirmed the September 19 high. There was no bearish Dow Theory divergence at the top.
Dow Theory is the Grand Daddy of market trend analysis and I’m not about to discredit it, however, no indicator should ever be viewed in isolation.
Dow Theory still suggests the bull market is in tact – which harmonizes with my research – but that doesn’t mean investors need to accept a 10% drawdown.
The bounce from the October low brought the Dow Jones back up to key resistance (not shown on chart, resistance available to subscribers of the Profit Radar Report). A move above this resistance is needed to confirm this bounce.
As with any long-term indicator, additional indicators can be used to prune long-term portfolios via better-timed sells and buys.
Simon Maierhofer is the publisher of the Profit Radar Report. The Profit Radar Report presents complex market analysis (S&P 500, Dow Jones, gold, silver, euro and bonds) in an easy format. Technical analysis, sentiment indicators, seasonal patterns and common sense are all wrapped up into two or more easy-to-read weekly updates. All Profit Radar Report recommendations resulted in a 59.51% net gain in 2013.
Follow Simon on Twitter @ iSPYETF or sign up for the FREE iSPYETF Newsletter to get actionable ETF trade ideas delivered for free.

|
