Like a commitment shy bachelor, the S&P 500 has been flirting with a bullish breakout, but unable to ‘put a ring on it.’
It’s not been an issue of persistence, more an issue of commitment.
This weekly S&P 500 (SNP: ^GSPC) bar chart highlights the dilemma.
The blue oval highlights at which point MACD confirmed prior rallies with a bullish crossover.
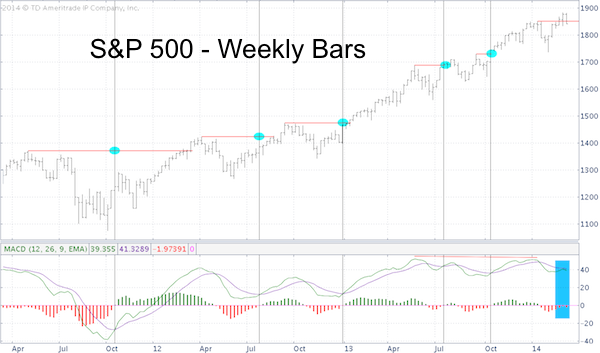
Since 2011, every S&P 500 rally was confirmed by a bullish MACD crossover on or before the week new S&P highs were reached.
Not this time. The S&P 500 (NYSEArca: SPY) moved to new highs three weeks ago, but the MACD Histogram (which measures the distance between MACD and its 9-day EMA) remains negative.
The March 9 Profit Radar Report featured the same chart and observed that: "MACD has not yet confirmed the S&P's up trend. This emphasizes the potential for an upcoming 'fork in the road'" (more about this 'fork in the road' in a moment).
Simply put, there was no reason to be long because the S&P didn't have the escape velocity needed to break out for good.
Although not shown on this chart, there’s another reason why the S&P 500 stalled and why it stalled exactly where it did. It reached a multi-year resistance. It’s the kind of resistance most investors aren’t aware of, that’s why it’s so effective. This perfectly explains the 'fork in the road' scenario mentioned above.
A closer look at this key resistance level and what it means for the S&P 500 going forward is available here:
Is it Too Late to Jump into Stocks? Watch How S&P Reacts to This Inflection Point
Simon Maierhofer is the publisher of the Profit Radar Report. The Profit Radar Report presents complex market analysis (S&P 500, Dow Jones, gold, silver, euro and bonds) in an easy format. Technical analysis, sentiment indicators, seasonal patterns and common sense are all wrapped up into two or more easy-to-read weekly updates. All Profit Radar Report recommendations resulted in a 59.51% net gain in 2013.
Follow Simon on Twitter @ iSPYETF or sign up for the FREE iSPYETF Newsletter to get actionable ETF trade ideas delivered for free.

|
