Pardon the sensationalistic touch of this headline, but ‘is this the beginning of the end?’ is a perfectly legitimate question. Not because I’m a fear monger, but because others are.
Several months ago – in May, June and July – many analysts predicted a market crash. Here are a few headlines from that time:
-
CNBC: “I’m worried about a crisis bigger than 2008: Dr Doom” – May 8
-
Yahoo: “Beware: 2014 looking a lot like 2007” – May 23
-
CNBC: “This chart shows the market is a ticking time bomb” – June 12
-
Yahoo: “Common Sense says look out for a market top” – June 30
-
Forbes: “These 23 charts prove that stocks are heading for a devastating crash” – July 1
Although the S&P 500 gained as much as 200 points since those crash prophecies first surfaced, investors now wonder if this is the ‘big one.’ Is this the time when crash prophesies turn into reality?
A Market Top or THE Market Top?
Obviously, the September 19 highs carry some importance, after all the S&P 500 and Dow Jones lost about 8% since.
Complex Analysis Made Easy - Sign Up for the FREE iSPYETF E-Newsletter
Perhaps looking at what caused this spirited selloff may help determine if September 19 is ‘A’ market top or ‘THE’ market top.
On August 24, the Profit Radar Report published this chart and stated that: “The Dow Jones sports a possible wedge formation with resistance starting at 17,250 next week (17,400 by the end of September).”
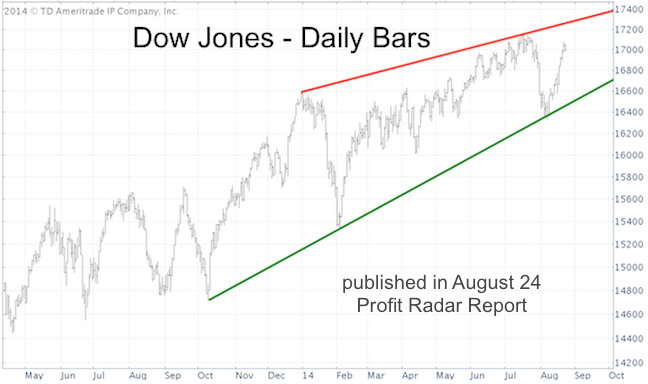
On September 19, the wedge resistance line was at 17,350, which marked the exact top of the Dow Jones.
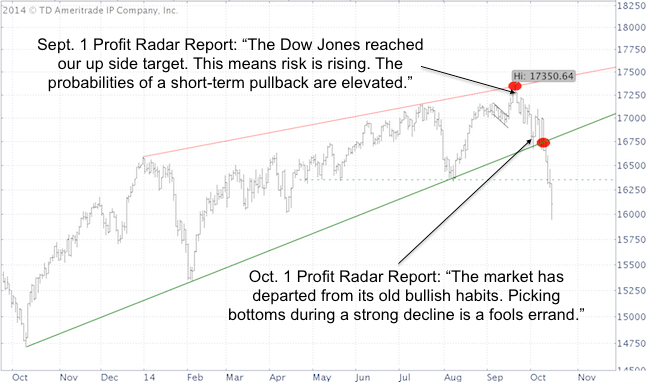
Consequently, the September 21 Profit Radar Report warned that: “The Dow Jones reached our up side target. This means risk is rising. The probabilities of a short-term pullback are elevated.”
Dow Jones Down Side Target
Based on the Dow’s performance, the wedge pattern is valid. The textbook down side target for a bearish wedge is its origin, which is around 15,000. One near-term down side target, identified by the October 10 Profit Radar Report, is 1,850. The S&P hit 1,850 this morning, and every time a target is met a bounce becomes likely. Nevertheless, today's low doesn't display the marks of a sustainable low yet.
Here is a look at a few other indicators:
Complex Analysis Made Easy - Sign Up for the FREE iSPYETF E-Newsletter
Sentiment
Stocks are oversold, but sentiment is not extremely bearish. Throughout 2013 and 2014 the S&P 500 rallied as soon as it hit an oversold condition.
The October 1 Profit Radar Report warned that this time might be different, as some of the biggest declines happen when stocks don’t bounce from oversold conditions.
Seasonality
VIX seasonality is approaching a significant seasonal high. S&P 500 seasonality is turning positive in the near future (detailed VIX and S&P 500 seasonality charts are available to subscribers of the Profit Radar Report).
Seasonality doesn’t preclude further losses, but appears strong enough to eventually erase all or most of the losses accrued recently.
Conclusion
Based on the Dow’s wedge formation/target, a 13% decline is possible. However, seasonality may cushion the down side risk.
This decline appears similar to the 2010 and 2011 corrections. I personally will be looking for a specific bottoming pattern (displayed at the 2010 and 2011 lows). The actual down side price target is somewhat fluid (the specific bottoming pattern is discussed in the Profit Radar Report). Once the bottoming pattern starts developing, we should be able to identify a key support level.
No doubt, the above-mentioned crash prophets are getting to enjoy their 15 minutes of fame, but the only indicator that actually predicted the 1987, 2000 and 2007 crash suggests that bulls will stage a comeback once this selloff is exhausted. Here is a close look at this impressive indicator.
The Missing Ingredient for a Major Bull Market Top
Simon Maierhofer is the publisher of the Profit Radar Report. The Profit Radar Report presents complex market analysis (S&P 500, Dow Jones, gold, silver, euro and bonds) in an easy format. Technical analysis, sentiment indicators, seasonal patterns and common sense are all wrapped up into two or more easy-to-read weekly updates. All Profit Radar Report recommendations resulted in a 59.51% net gain in 2013.
Follow Simon on Twitter @ iSPYETF or sign up for the FREE iSPYETF Newsletter to get actionable ETF trade ideas delivered for free.

|
