“Here is where the rubber meets the road.”
“The proof is in the pudding.”
“It’s do or die time.”
Any of the above phrases describe the market’s current position. Stocks have arrived at an inflection point or fork in the road.
How the market got here is interesting and provides a clue to the next move.
Just a month ago tech and small cap stocks dared to fall a ‘stunning’ 10%. Disregarding the fact that the Dow Jones and S&P 500 remained within striking distance of their all-time highs, investors turned bearish.
The market wanted investors to believe it will fall further and they obliged and fell for the bluff. In early May, 71.3% of retail investors polled by AAII were bearish or neutral. Being short or in cash was crowed fashionable.
Via the May 4 Profit Radar Report I asked: “How will the market fool the crowded trade? The ‘chart detective’ inside of me favors a shallow dip (1,874 – 1,850) followed by a pop to 1,915.”
A pop was needed to fool the premature bears. Mission accomplished!
The S&P 500 (SNP: ^GSPC) popped to 1,915 and beyond. In fact, on the chart the bounce looks so convincing that we need to ask if it's more than just fake out break out. Is it?
Price Up – Confidence Down
I follow many different gauges and indicators, one of them is a proprietary measure of supply and demand.
The basic ingredients to this complex breadth formula are trading volume, points gained/lost, and advancing/declining issues. All figures are calculated on a raw, ratio and percentage basis over multiple time periods.
Since 2009 these forces of supply and demand have persistently foreshadowed continued gains, even during the 2010, 2011 and 2012 corrections.
Buying power actually decreased and selling pressure increased since May 22, when the S&P 500 (NYSEArca: SPY) broke out. The lack of demand suggests that buyers are not convinced. The absence of many new sellers suggests that stock owners don’t feel compelled to sell.
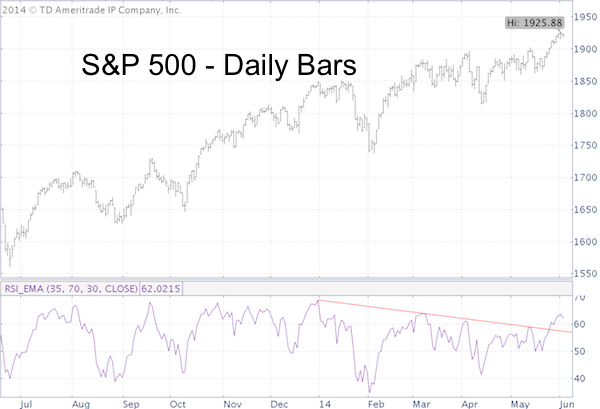
Albeit not as reliable as supply/demand measure, RSI aptly illustrates the divergence between price and momentum. RSI broke above trend line resistance on May 24, but is significantly below prior highs.
Approaching a Hill With an Empty Gas Talk
With lagging breadth, the four major indexes (Dow Jones, S&P 500, Nasdaq Composite and Russell 2000) are also approaching key resistance levels.
This is akin to a car approaching a hill with the gas tank on “E”, or a gymnast being out of breath near the springboard. It takes force to overcome obstacles. At this point it’s questionable if the market has enough force to overcome resistance.
However, if the various indexes can overtake their respective resistance level it should act as a springboard it propel stocks higher.
Sunday's Profit Radar Report identified the key resistance levels for all major indexes along with the most likely outcome.
One way to gauge a possible outcome is to analyse the 'intent' of the current rally. What 'intent'?
You'll know what I mean once you take a look at this article:
Hey Bears! Where is the Promised Correction?
Simon Maierhofer is the publisher of the Profit Radar Report. The Profit Radar Report presents complex market analysis (S&P 500, Dow Jones, gold, silver, euro and bonds) in an easy format. Technical analysis, sentiment indicators, seasonal patterns and common sense are all wrapped up into two or more easy-to-read weekly updates. All Profit Radar Report recommendations resulted in a 59.51% net gain in 2013.
Follow Simon on Twitter @ iSPYETF or sign up for the FREE iSPYETF Newsletter to get actionable ETF trade ideas delivered for free.

|
