Stock exposure just reached the highest level since 2007 and investors’ cash cushion has shriveled to the lowest level since 2000. Is this as scary as it sounds?
Data like this, especially when it stirs up financial crisis memories, should be viewed in context of the bigger picture.
Here’s what happened:
The latest American Association for Individual Investors (AAII) asset allocation poll showed that investors racked up their stock allocation to 68.6%, the highest level since June 2007.
At the same time, the cash cushion shrunk to 14.9%, the lowest since January 2000.
We all know what happened right after January 2000 and June 2007. But it takes a longer-term chart to tell the whole story truthfully.
Never Miss a Beat! >> Sign up for the FREE iSPYETF e-Newsletter
The chart below plots the S&P 500 against investors’ allocation to stocks and cash going back to 1987.
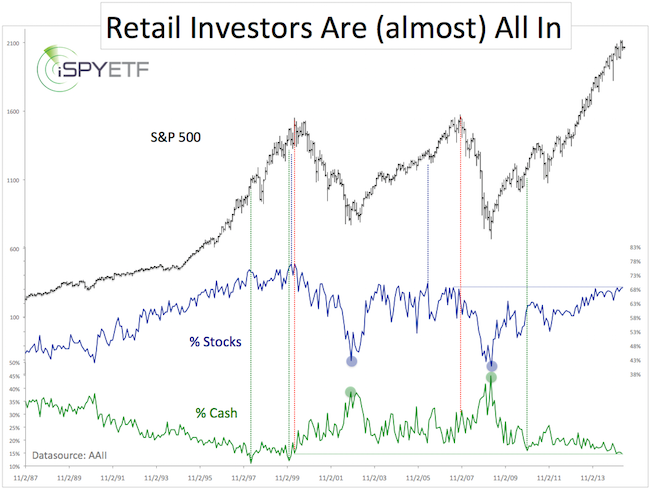
Here’s what stands out regarding the 2000 market top:
The all-time cash % low (11%) occurred in March 1998, two years before the 2000 top.
A secondary cash % low happened in January 2000 (14%), very near the 2000 top.
The all-time stock % high (77%) occurred in January and March 2000, very near the 2000 top.
Here’s what stands out regarding the 2007 market top:
Stock allocation (70%) peaked 18-month before the 2007 S&P 500 high.
Cash allocation didn’t reach a significant low (16%) until November 2010.
There were no allocation extremes near the 2007 market top.
Never Miss a Beat! >> Sign up for the FREE iSPYETF e-Newsletter
Conclusion:
A monkey that sits on the ground cannot fall from the tree. The AAII data shows that, metaphorically speaking, most ‘investors are sitting high up the tree.’
If (or when) the stock market gets rattled, a ton of investors will be shaken out of the tree and fall hard.
The operative word is ‘if.’ Just because current cash and stock allocation matches the 2000 and 2007 levels, doesn’t mean a market crash is imminent.
There is a much more accurate major market top indicator than the AAII data. This indicator correctly foreshadowed the 1987, 2000 and 2007 top. You may read more about it here: Is the S&P 500 Carving Out a Major Market Top?
As the blue and green circles illustrate, the AAII poll data is more effective in predicting market bottoms than market tops.
Simon Maierhofer is the publisher of the Profit Radar Report. The Profit Radar Report presents complex market analysis (S&P 500, Dow Jones, gold, silver, euro and bonds) in an easy format. Technical analysis, sentiment indicators, seasonal patterns and common sense are all wrapped up into two or more easy-to-read weekly updates. All Profit Radar Report recommendations resulted in a 59.51% net gain in 2013 and 17.59% in 2014.
Follow Simon on Twitter @ iSPYETF or sign up for the FREE iSPYETF Newsletter to get actionable ETF trade ideas delivered for free.

|
