There were 105 S&P 500 selling climaxes last week. This means that 105 of the 500 S&P stocks (21%) dropped to new 52-week lows, but bounced back to end the week with a gain.
Selling climaxes are considered a sign of accumulation as ‘strong hands’ buy the stocks offered for sale by ‘weak hands.’
The S&P 500 Index itself also saw a selling climax. The chart below highlights all weekly reversals (not all of them led to 52-week lows) since mid-2013. All but one (August 24, 2015) were followed by at least another week of gains.
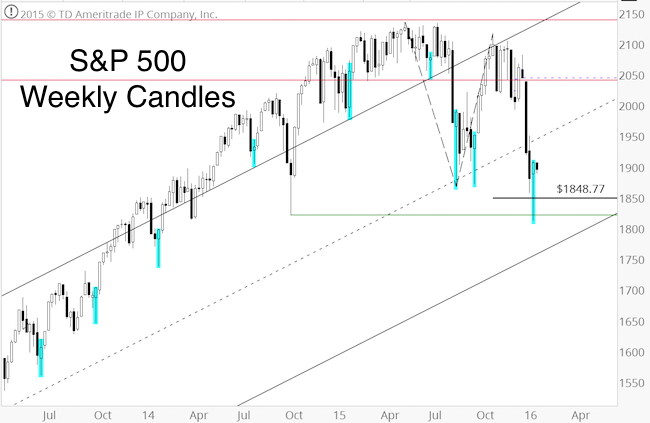
The weekly bar chart also shows that the S&P 500 reached (and exceeded) the minimum down side target at 1,848.77 and the October 2014 low at 1,820.66.
The January 18 Profit Radar Report proposed that a break below S&P 1,870 would lead to a swift drop to 1,820, but listed five reasons why stocks should bounce thereafter.
If you enjoy quality, hand-crafted research, >> Sign up for the FREE iSPYETF Newsletter
With the minimum down side target(s) met, the odds of a bounce or more lasting low have increased.
It remains to be seen whether this bounce will stick or eventually (perhaps after weeks of chopping around) roll over.
A break below 1,812 would unlock the next down side targets. Such a break, if it does occur, would probably set up a better buying opportunity (assuming there will be a number of bullish divergences).
Continued updates and analysis are provided via the Profit Radar Report.
Simon Maierhofer is the publisher of the Profit Radar Report. The Profit Radar Report presents complex market analysis (S&P 500, Dow Jones, gold, silver, euro and bonds) in an easy format. Technical analysis, sentiment indicators, seasonal patterns and common sense are all wrapped up into two or more easy-to-read weekly updates. All Profit Radar Report recommendations resulted in a 59.51% net gain in 2013 and 17.59% in 2014.
Follow Simon on Twitter @ iSPYETF or sign up for the FREE iSPYETF Newsletter to get actionable ETF trade ideas delivered for free.
If you enjoy quality, hand-crafted research, >> Sign up for the FREE iSPYETF Newsletter
|
