The Russell 2000 index of small cap stocks just pushed to new all-time highs.
Is this bullish for stocks?
To find out, I’ve plotted the S&P 500 against the IWM:IWB (small cap/large cap) ratio.
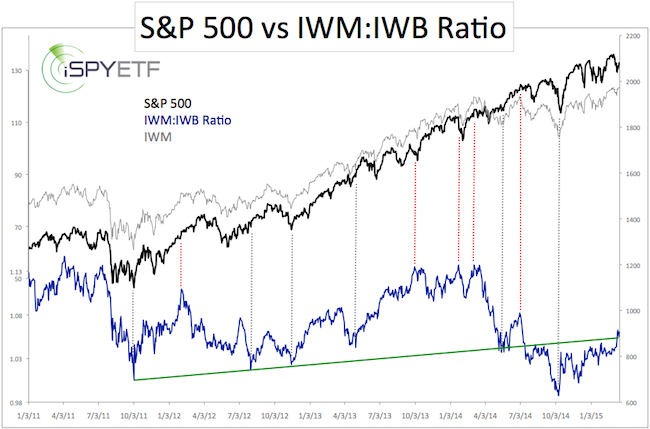
IWM is the iShares Russell 2000 ETF (NYSEarca: IWM). IWB is the iShares Russell 1000 ETF (NYSEArca: IWB).
Based on the ratio (currently at 1.06), the recent outperformance is by no means extreme.
What if we pretend for a moment that small cap outperformance was extreme (reading of 1.10 or greater)?
The red lines mark prior periods of small cap outperformance (IWM:IWB > 1.10). The S&P 500 (NYSEArca: SPY) couldn’t care less.
If anything, one could make an argument that extreme small cap underperformance works as buy signal. The dashed gray lines highlight readings smaller than 1.03.
Never Miss a Beat! >> Sign up for the FREE iSPYETF e-Newsletter
The gray overlay of the iShares Russell 2000 Small Cap ETF (IWM), makes it clear that IWM is only trading 3% above where it was a year ago. The S&P 500 gained 13% since March 2014.
Small caps are often portrayed to be the engine that pulls the train (or at least the canary in the mine), but that’s not true.
We dispelled this myth in July when many jumped on the ‘small caps are down, the market’s going to crash’ bandwagon.
Perhaps recent small cap outperformance is a reflection of the idea that a strong dollar hurts multi-national large caps with overseas income more than small domestic companies.
But what happens if dollar strength takes a breather?
One more thought: Historically, small caps tend to under perform in the later stages of a bull market.
Simon Maierhofer is the publisher of the Profit Radar Report. The Profit Radar Report presents complex market analysis (S&P 500, Dow Jones, gold, silver, euro and bonds) in an easy format. Technical analysis, sentiment indicators, seasonal patterns and common sense are all wrapped up into two or more easy-to-read weekly updates. All Profit Radar Report recommendations resulted in a 59.51% net gain in 2013 and 17.59% in 2014.
Follow Simon on Twitter @ iSPYETF or sign up for the FREE iSPYETF Newsletter to get actionable ETF trade ideas delivered for free.

|
