Here is a brief excerpt from Sunday’s (November 15) Profit Radar Report (PRR), which highlighted the key short-term S&P 500 level to watch … and much more:
“The S&P 500 chart is painting a truly fascinating constellation. First we’ll take a look at the two most likely outcomes, than we’ll discuss probabilities.
The S&P couldn’t get off the mat at 2,040, which resulted in a drop to 2,022, as proposed in the November 12 PRR.
2,021 is a special support level. Why? (see blue bubbles)
-
It’s the September spike high
-
It acted as support/resistance in October
-
It is the 38.2% Fibonacci retracement level of the rally from the August 24 low to the November 3 high.
Elliott Wave Theory is another facet adding to the allure of the 2,021 level. The S&P rallied in a discernable 3-wave pattern from the August 24 low (black numbers).
If the rally from the August low is a counter trend move, it likely ended on November 3 at 2,116.48. If that’s the case, the S&P should work its way towards and perhaps beyond the August low (red arrow).
If the rally from the August 24 low wants to turn into a 5-wave move, the rally is likely to continue next week. If that’s the case, the decline from the November 3 high is a wave 4 correction, followed by a wave 5 rally to new highs (green number + green arrow).
Based purely on chart analysis, both scenarios are equally viable.
The CBOE Equity Put/Call Ratio (dark blue - bottom graph) shows that option traders are bearish to an extreme.
S&P 500 seasonality (light blue – top graph) is predominantly bullish for the remainder of the year.
If you enjoy quality, hand-crafted research, >> Sign up for the FREE iSPYETF Newsletter
S&P 500 futures are currently down 8 points and were down as much as 20 points in Sunday night's trade. If weakness continues overnight, the S&P 500 cash index may open below 2,020 in the morning.
Stocks are oversold and a gap down open could easily be reversed. Just as it wasn't smart to chase the up side in early November, it isn't prudent to chase the down side at this moment.
We will consider going long the S&P if it drops below 2,020 and subsequently closes above 2,020.”
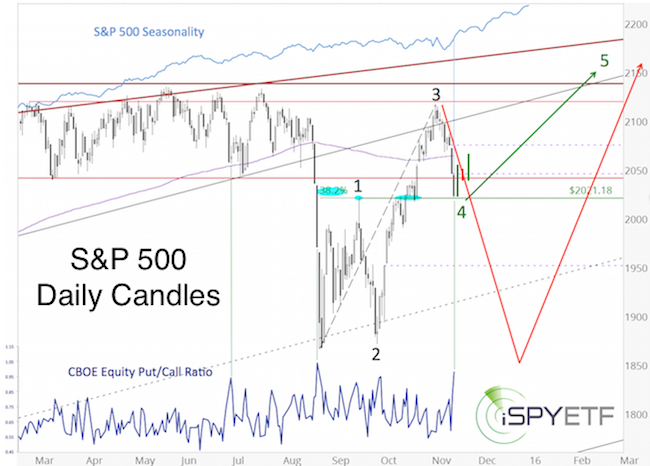
The green bars show the performance since Sunday. As suggested by the CBOE equity put/call ratio and seasonality, the S&P 500 bounced from key support at 2,020.
The simplified conclusion is that the path of least resistance is up as long as support at 2,020 holds.
A break below 2,020 does not necessarily have to be bearish, but it would complicate the structure and possibly result in a whipsaw across 2,020
Continued updates are available via the Profit Radar Report.
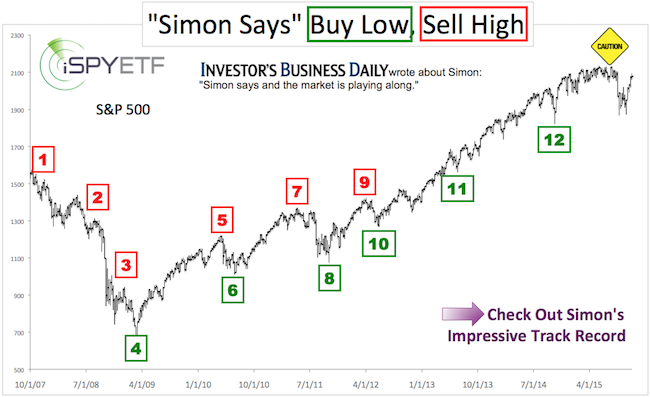
Simon Maierhofer is the publisher of the Profit Radar Report. The Profit Radar Report presents complex market analysis (S&P 500, Dow Jones, gold, silver, euro and bonds) in an easy format. Technical analysis, sentiment indicators, seasonal patterns and common sense are all wrapped up into two or more easy-to-read weekly updates. All Profit Radar Report recommendations resulted in a 59.51% net gain in 2013 and 17.59% in 2014.
Follow Simon on Twitter @ iSPYETF or sign up for the FREE iSPYETF Newsletter to get actionable ETF trade ideas delivered for free.
If you enjoy quality, hand-crafted research, >> Sign up for the FREE iSPYETF Newsletter
|
