My January 4 article included a longer-term S&P 500 forecast. You may view the longer-term forecast here (it even includes one recent update): Initial 2015 S&P 500 Forecast.
Today’s update will be more short-term in nature.
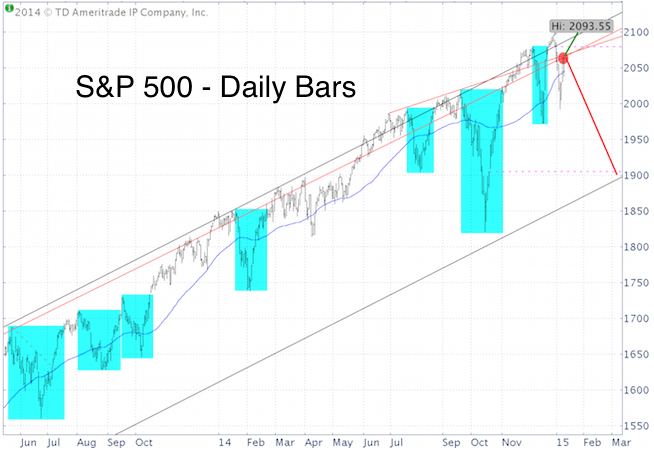
Allow me to start out with an observation (and chart) shared in the January 11 Profit Radar Report:
“The market always tries to separate as many people as possible from their money, and it is very successful at it. In fact, the market is a master in ‘psychological warfare.’ As a mental exercise, I sometimes try to imagine which market move would surprise most investors.
Since mid-2013 we’ve had no less than seven obvious V-shaped recoveries. Is number eight about to follow? The majority of investors may think so. If that were the case, another leg down prior to a new all-time high would hurt many and therefore fit the market’s MO.
Of course, one could have made the same argument after V-shaped bottom #5, #6 or #7. The red circle shows that the market pulled back from double trend line resistance. This time could be different.
I personally favor the odds of another leg down. Key support is around 2,016 and 1,992.44.”
The S&P 500 (NYSEArca: SPY) tested (and bounced from) 1,992 yesterday and again today.
The VIX/VXN ratio signaled an extreme reading yesterday, which may lead to a bounce, but there doesn’t appear to be enough (panic) selling for a more last low. More details about the VIX indicator here: VIX Options Traders Ratio Signals S&P 500 Bounce
With or without bounce, another low is likely. In fact, a bounce may offer an even better ‘sell the pop’ entry point to go short.
I’m not unconditionally married to that outlook, but it would take a move above resistance to change it. Key resistance and down side target levels are available to subscribers of the Profit Radar Report.
Simon Maierhofer is the publisher of the Profit Radar Report. The Profit Radar Report presents complex market analysis (S&P 500, Dow Jones, gold, silver, euro and bonds) in an easy format. Technical analysis, sentiment indicators, seasonal patterns and common sense are all wrapped up into two or more easy-to-read weekly updates. All Profit Radar Report recommendations resulted in a 59.51% net gain in 2013.
Follow Simon on Twitter @ iSPYETF or sign up for the FREE iSPYETF Newsletter to get actionable ETF trade ideas delivered for free.

|
