Gold prices just can’t get a bit. Fundamental analysts struggle to explain gold’s lackluster performance as central banks (in particular China) continue to gobble up the precious yellow metal.
Here’s a quick look at some support/resistance levels that have guided gold prices – think of them as technical handrails.
Red lines = resistance, green lines = support.
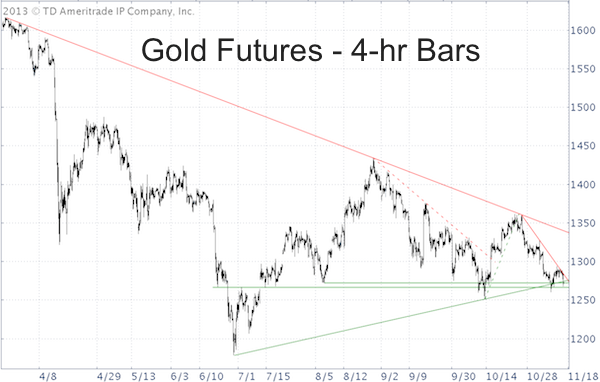
Short-term resistance (red line) was around 1,290 this morning. A move above 1,290 would have been short-term bullish for gold and gold ETFs like the SPDR Gold Shares (NYSEArca: GLD) and iShares Gold Trust (NYSEArca: IAU).
But resistance held and gold prices peeled away before finding support around 1,268.
The chart shows that the margin between support and resistance is shrinking, increasing the odds of a breakout.
A move above 1,290 or so would unlock a target of 1,340 +/-.
A move below 1,265 and 1,250 would suggest new lows.
The charts for the SPDR Gold Shares and iShares Gold Trust look similar.
Regardless of the short-term gyrations, the long-term gold chart suggests new lows and a better buying opportunity are still forthcoming.
A detailed look at the long-term gold chart along with target levels for a new low is available here: GLD Gold ETF Analysis
Simon Maierhofer is the publisher of the Profit Radar Report. The Profit Radar Report uses technical analysis, dozens of investor sentiment gauges, seasonal patterns and a healthy portion of common sense to spot low-risk, high probability trades (see track record below).
Follow Simon on Twitter @ iSPYETF or sign up for the iSPYETF Newsletter to get actionable ETF trade ideas delivered for free.

|
