The SPDR S&P 500 ETF (NYSEArca: SPY) displayed some bearish patterns based on conventional technical analysis.
However, conventional analysis only works in a conventional market, not necessarily in a QE market.
Here is the bearish pattern and its interpretation (conventional and non-conventional).
Last Thursday the S&P 500 ETF dropped below the 20-day SMA on increased trading volume. On Friday, the S&P 500 dropped below green support, also on increased volume (blue bars).
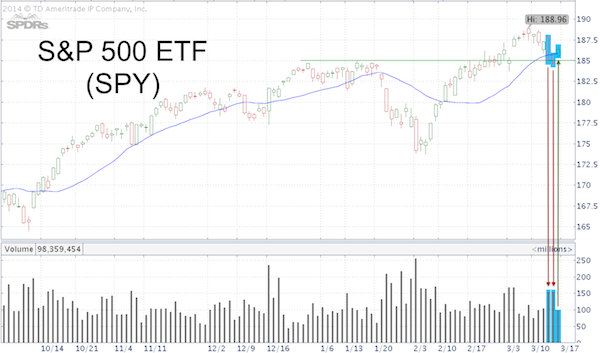
On Monday, SPY gapped above green resistance (prior support) and closed above the 20-day SMA on much lower volume.
Conventional interpretation: Volume = conviction and conviction on the way down was much higher than on the way up. This suggests more selling to come.
The non-conventional interpretation takes into account a similar prior pattern (second chart).
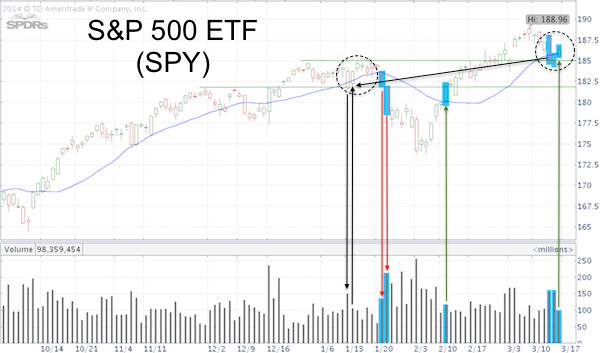
On January 23 and 24 the S&P 500 ETF and S&P 500 (SNP: ^GSPC) sliced below the 20-day SMA and prior high support on elevated volume (blue bars).
The recovery back above resistance (prior support) and the 20-day SMA occurred on anemic volume, but nevertheless pushed SPY to a new all-time high.
Based on the non-conventional interpretation, the bearish volume pattern may mean nothing.
There may also be a third interpretation. The current volume/price pattern could correspond to the brief dip below support and the 20-day SMA on January 13 (black circle).
This would suggest a bit more sideways trading followed by another leg down (which is my personal favorite).
In summary, this analysis doesn’t tell us what’s next, but it shows that:
-
The S&P’s recent dip on increased volume is not necessarily bearish. A drop below 184.44 (the March 14 low) would change that and point to lower prices (watch next support).
-
Monday's bounce was weak (despite today's follow up). The S&P 500 ETF needs to move above 188 to unlock higher targets.
Based on insider selling, an eventual relapse is quite likely.
Here's a look at the most extreme reading of a unique insider sales metric:
Murky Message: Insiders Dump Stocks at Record Pace
Simon Maierhofer is the publisher of the Profit Radar Report. The Profit Radar Report presents complex market analysis (S&P 500, Dow Jones, gold, silver, euro and bonds) in an easy format. Technical analysis, sentiment indicators, seasonal patterns and common sense are all wrapped up into two or more easy-to-read weekly updates. All Profit Radar Report recommendations resulted in a 59.51% net gain in 2013.
Follow Simon on Twitter @ iSPYETF or sign up for the FREE iSPYETF Newsletter to get actionable ETF trade ideas delivered for free.

|
