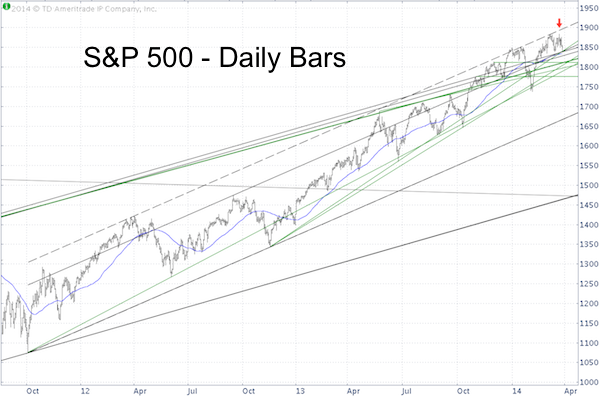
This is probably the messiest S&P 500 chart I’ve ever published, but it conveys two very important points:
-
The stock market’s action has been messy. The S&P 500 (SNP: ^GSPC) chart shows a lot of overlap along with false breakouts and false breakdowns. This has created a lot of technical support (and resistance) levels.
-
There are two support clusters. The first support cluster is around 1,825 – 1,840. The second support cluster is around 1,790 – 1,810.
The March 21 rally was the most recent fake breakout (red arrow). Morning trade pushed the S&P 500 to a new all-time high, followed by persistent selling.
A special March 21 morning Profit Radar Report update warned that: “One Elliott Wave count allows for a fake out breakout, followed by a drop lower. Today is Triple Witching. The S&P 500 (NYSEArca: SPY) closed lower on Triple Witching day 71% and the week after Triple Witching 66% of the time.”
This particular ‘Elliott Wave count’ mentioned in the March 21 Profit Radar Report projects lower prices, but the S&P 500 will have to move below the 1,840 support cluster to unlock lower targets.
For the last few days, the Russell 2000 has been our 'canary in the mine.' The Russell 2000 captured our first down side target yesterday (view article here: Russell 2000 Captures First Down side Target). As always, when a target is reached, there's an above average chance of a reversal.
S&P 500 resistance is at 1,866 - 1,870.
For now the S&P 500 is stuck in 'technical purgatory.'
Various indicators suggest new all-time highs eventually. The question is whether we’ll see a deeper correction before that.
Continuous updates are available via the Profit Radar Report.
Here is one indicator to watch for a false breakdown: Beware of False Treasury Breakout (False S&P 500 Breakdown)
Simon Maierhofer is the publisher of the Profit Radar Report. The Profit Radar Report presents complex market analysis (S&P 500, Dow Jones, gold, silver, euro and bonds) in an easy format. Technical analysis, sentiment indicators, seasonal patterns and common sense are all wrapped up into two or more easy-to-read weekly updates. All Profit Radar Report recommendations resulted in a 59.51% net gain in 2013.
Follow Simon on Twitter @ iSPYETF or sign up for the FREE iSPYETF Newsletter to get actionable ETF trade ideas delivered for free.

|
