On July 8 we used a little known indicator to spot key support for the S&P 500 (SNP: ^GSPC).
This little known indicator (which got some flak on the Yahoo comment board, but proved yet again correct) is a good tool when it comes to identifying the end of a momentum rally.
The indicator is called percentR (don’t shoot the messanger, I didn’t name it).
Never heard of it? That’s because you won’t read about this indicator on CNBC, MarketWatch or Bloomberg. That’s is a good thing. Just recall how many charts and indicators the media has used in recent months to warn of a major crash (too much media coverage spoils any good indicator).
The July 8 Profit Radar Report wrote this about percentR: “The S&P 500 fell to test support at 1,955 and triggered a bullish percentR low-risk entry. This may cause a bounce (perhaps even another stab at all-time highs), but a close below today’s low (1,959) and support at 1,955 would be a small victory for bears.”
The July 13 Profit Radar Report put it this way: “As discussed last week, important short-term support is at 1,959 – 1,955. A close below 1,955 will increase the odds for a deeper correction.”
Here is an updated look at percentR, plotted against the S&P 500, and how it works:
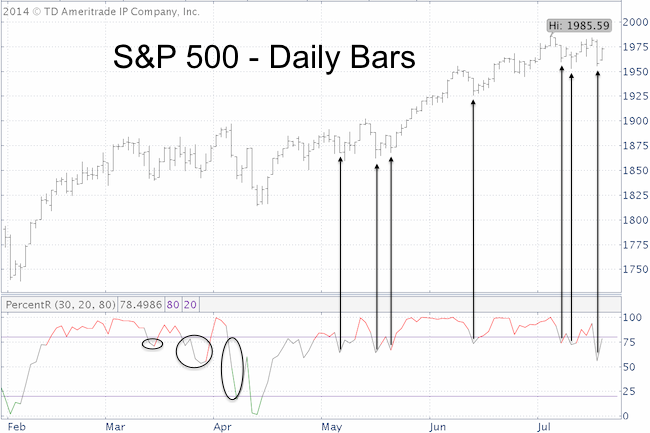
An initial percentR dip below 80 is called a ‘bullish low-risk entry’.
The arrows mark all bullish low-risk entries since May. All seven of them were followed by bounces.
The black circles illustrat failed low-risk entries.
What is a failed low-risk entry? When the S&P 500 (NYSEArca: SPY) closes below the level (daily low) that triggered the low-risk entry (dashed red box).
Here is where it gets interesting: percentR has triggered three low-risk entries since July 8 with daily lows ranging from 1,953 – 1,959. This shows a) that the rally is getting choppy and b) that the 1950 – 1960 level seems significant.
A close below 1,953 would be a failed low-risk entry and an indication that the rally may be over.
The summary section of the July 6 Profit Radar Report still remains valid. It stated:
“Forward looking indicators, such as the SKEW and VIX seasonality, suggest that stocks should soon run into trouble. However, the charts don’t show any weakness yet. S&P 1,980 – 1,985 and psychological resistance at 2,000 should cap any up side, but it will take a move below 1,955 and 1,925 to boost the notion of a correction.”
In the spirit of disclosure, I want to mention that there is one scenario that sees a brief dip below 1,950 followed by a rally to new highs. It would be wicked and fool most of Wall Street (which is exactly how the market likes it).
VIX seasonality is fascinating right now, because the VIX seasonality chart projected a major low on July 9. So Thursday’s 32% one-day VIX spike is no real surprise.
Here’s a detailed look at the VIX seasonality chart and it’s possible implications for the S&P 500.
VIX Seasonality Triggers Major Buy Signal on July 9
Simon Maierhofer is the publisher of the Profit Radar Report. The Profit Radar Report presents complex market analysis (S&P 500, Dow Jones, gold, silver, euro and bonds) in an easy format. Technical analysis, sentiment indicators, seasonal patterns and common sense are all wrapped up into two or more easy-to-read weekly updates. All Profit Radar Report recommendations resulted in a 59.51% net gain in 2013.
Follow Simon on Twitter @ iSPYETF or sign up for the FREE iSPYETF Newsletter to get actionable ETF trade ideas delivered for free.

|
