Selling climaxes are considered a sign of accumulation as ‘strong hands’ happily buy the stocks offered for sale by ‘weak hands.’
A selling climax happens when a stock/index or ETF drops to a 12-month low, but bounces back and closes the week with a gain.
There were 605 selling climaxes last week; the Russell 2000 was one of them (more details here: Will Bullish Russell 2000 Signals Last?).
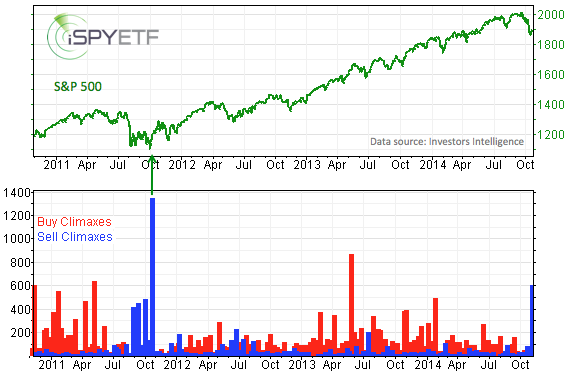
As the chart above shows, the last time there were more than 500 selling climaxes was the week ending October 7, 2011, when over 1,350 stocks saw a bullish reversal from a 52-week low.
Many happy bulls and frustrated bears will likely remember that the S&P 500 hit a major bottom on October 4, 2011.
I remember the October 4, 2011 low at 1,074 like it was yesterday, probably because it was one of my best calls. My October 2, 2011 note to subscribers said the following:
“The ideal market bottom would see the S&P 500 dip below 1,088 intraday followed by a strong recovery and a close above 1,088, but technically any new low below 1,102 could mark the end of this bear market leg.”
Complex Analysis Made Easy - Sign Up for the FREE iSPYETF E-Newsletter
The problem with weekly climax data is the time delay. By the time Investors Intelligence reported last week’s climaxes, the S&P 500 was already 70 points above its low.
A closer look at the Russell 2000 chart shows that, although the spike in buying climaxes is net bullish, stocks are not out of the woods yet.
Here’s a look at the Russell 2000: Bullish Russell 2000 Signals - Will They Last?
Simon Maierhofer is the publisher of the Profit Radar Report. The Profit Radar Report presents complex market analysis (S&P 500, Dow Jones, gold, silver, euro and bonds) in an easy format. Technical analysis, sentiment indicators, seasonal patterns and common sense are all wrapped up into two or more easy-to-read weekly updates. All Profit Radar Report recommendations resulted in a 59.51% net gain in 2013.
Follow Simon on Twitter @ iSPYETF or sign up for the FREE iSPYETF Newsletter to get actionable ETF trade ideas delivered for free.

|
