Not everything that shines is gold, and not everything that’s gold is immune to losses.
Just a couple of years ago investors followed the allure of the ‘invincible’ yellow metal … and got hurt to the tune of 36%.
Are stocks the new gold?
It doesn’t look like it, at least not yet.
We are not seeing the type of pronounced divergences that precede major market tops for the S&P 500 (SNP: ^GSPC).
Nevertheless, the odds for a deeper correction and the risk of owning stocks are rising.
The chart below plots the S&P 500 against an uncommonly used index, the CBOE SKEW Index.
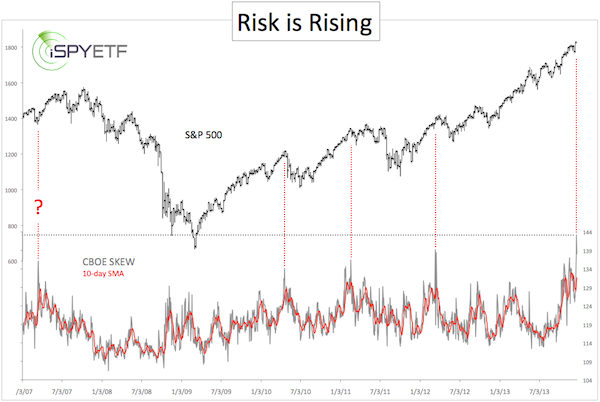
According to CBOE, the SKEW is designed to measure the tail risk (= risk of outlier returns two or more standard deviations below the mean) of the S&P 500. The SKEW Index basically estimates the probably of a large decline.
Similar to the CBOE VIX or VIX Volatility Index (Chicago Options: ^VIX), the price of the S&P 500 tail risk is calculated from the price of the S&P 500 out-of-the-money options.
The SKEW typically ranges from 115 to 135. Readings of 135+ suggest a 12% chance of a large decline (2 standard deviations). Readings of 115 or less suggest a 6% chance of a large decline.
Last Friday the SKEW jumped to 143.20, the second-highest reading in the survey’s 14-year history and the highest since October 1998.
As the first chart shows, the last three times the SKEW ventured into similarly lofty territory, the S&P 500 (NYSEArca: SPY) corrected shortly thereafter.
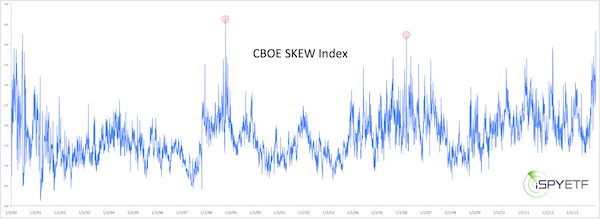
The long-term SKEW chart (going back to 1990) shows ‘ancient’ highs in October 1998 and March 2006. Both times nothing significant happened.
The Fed’s QE has distorted many indicators. One example is the VIX (NYSEArca: VXX), which has lost its contrarian indicator mojo.
Based on the above data it’s possible that, unlike the VIX, the SKEW actually thrives in the QE environment and has become more accurate.
Also worth considering is that the SKEW expresses probabilities. There currently is about a 20% chance of a sizeable decline. That doesn’t mean it will happen, but the odds are higher than at any other time in the last few years.
Many sentiment readings echo the message of the SKEW: Risk is rising.
At a time like this – when the trend is up, but the risk is high – it’s crucial to have a stop-loss level in place,. A break below support after long and overextended rallies can cause a minor meltdown. Without a safety net your portfolio can melt away.
The key ‘melt down warning support’ along with a short-term forecast for the S&P 500 and Dow Jones is identified here:
“Will Stocks Suffer a ‘Pop and Drop’ or Rally into the New Year?"
Simon Maierhofer is the publisher of the Profit Radar Report. The Profit Radar Report presents complex market analysis (stocks, gold, silver, euro and bonds) in an easy format. Technical analysis, sentiment indicators, seasonal patterns and common sense are all wrapped up into two or more easy-to-read weekly updates. We are accountable for our work, because we track every recommendation (see track record below).
Follow Simon on Twitter @ iSPYETF or sign up for the FREE iSPYETF Newsletter to get actionable ETF trade ideas delivered for free.

|
