What is the ‘sudden drop’ index?
It’s the CBOE SKEW Index, calculated by the Chicago Board Options Exchange (CBOE). The CBOE also formulated the SKEW’s more popular cousin, the VIX.
According to CBOE, the SKEW is designed to measure the tail risk of the S&P 500.
What’s tail risk?
Tail risk is the risk of outlier returns two or more standard deviations below the mean. Some call this a ‘Black Swan’ event or simply a sudden drop.
Similar to the VIX, the price of the S&P 500 tail risk is calculated from the price of the S&P 500 out-of-the-money options.
The SKEW typically ranges from 115 to 135. Readings of 135 suggest a 12% chance of a large decline (2 standard deviations). Readings of 115 suggest a 6% chance of a large decline.
What is the SKEW’s track record?
SKEW Index data extends back to January 1, 1990. On June 20, 2014, the SKEW spiked to 143.26, the second highest level in its history.
Is this reason to worry?
The chart below plots the S&P 500 (SNP: ^GSPC) against the SKEW. The red bars highlight prior readings above 135.
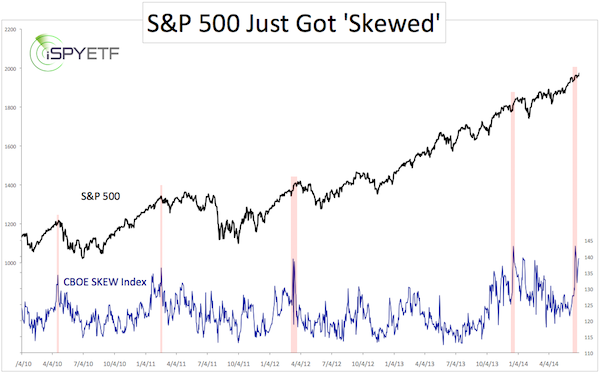
Although the highest reading in the SKEW’s history (146.22 on 10/16/1998) did not have any ill effect on the market, the SKEW has been a trustworthy indicator since the beginning of the QE bull market.
According to the SKEW, the odds for a swift decline are near a historic max. However, the bearish SKEW should be balanced with the indicator that foresaw a persistent S&P 500 (NYSEArca: SPY) rally without correction months ago.
A detailed look at this truly fascination gauge is available here:
The Only Indicator That Foresaw a Persistent S&P 500 Rally with No Correction
Simon Maierhofer is the publisher of the Profit Radar Report. The Profit Radar Report presents complex market analysis (S&P 500, Dow Jones, gold, silver, euro and bonds) in an easy format. Technical analysis, sentiment indicators, seasonal patterns and common sense are all wrapped up into two or more easy-to-read weekly updates. All Profit Radar Report recommendations resulted in a 59.51% net gain in 2013.
Follow Simon on Twitter @ iSPYETF or sign up for the FREE iSPYETF Newsletter to get actionable ETF trade ideas delivered for free.

|
