It’s been an interesting week, so I want to briefly recap what happened and what’s likely to happen next.
The November 27 Profit Radar Report summed up our plan for the weeks to come as follows: “A temporary correction in early December is becoming more and more likely. We are looking to go into cash and go short if our Dow Jones short trigger is filled.”
We are always looking for the broad index with the best low-risk setup. For our November long trade this was the S&P 500 via the S&P 500 ETF (NYSEArca: SPY). The S&P 500 reached our up side target at 1,810, so we closed our short position.
The main reason we expected a correction was the Dow Jones (DJI: ^DJI) chart.
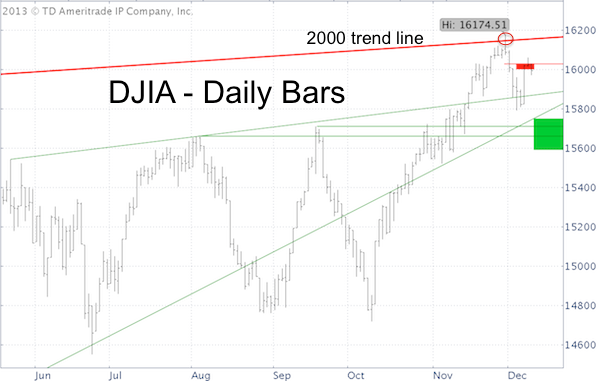
The bold red line shown (at 16,150) in the Dow Jones chart below actually goes back to the 2000 highs. This is significant resistance. Sentiment was already overheated, so if a correction was to occur it should be right there. We went short the Dow Jones at 16,100.
The December 4 Profit Radar Report expected a bounce into the red area followed by another leg down into the green area for both the Dow Jones and S&P 500.
The bounce happened, which brings us up to date.
The notion of another down leg remains alive, but the bounce has been stronger and more persistent than expected. We now need to look at an alternative outcome.
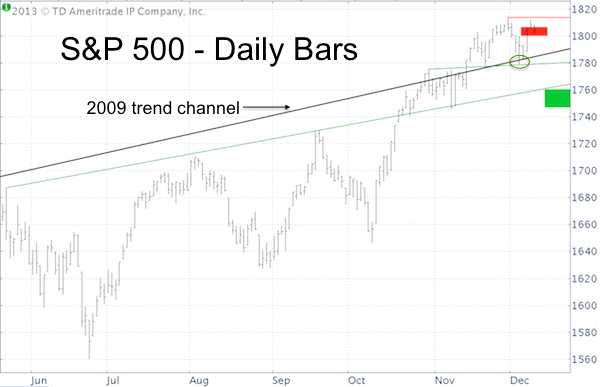
Any move above the S&P 500 (SNP: ^GSPC) all-time high at 1,813.55 will reduce the odds significantly of an immediate down turn and favor higher prices.
A move above S&P 1,813.55 would normally be a buy signal, but the Dow Jones (NYSEArca: DIA) is lagging (stuck at the 61.8% Fibonacci retracement level) and sentiment is dangerously bullish.
Although we were expecting another leg down the writing on the wall suggests stocks want to move higher. We have the stop-loss for our short Dow Jones position just below our entry point to virtually assure a winning trade.
Is it worth going long as the S&P 500 breaks to the up side? Perhaps for short-term traders looking to capture one or two percent.
Simon Maierhofer is the publisher of the Profit Radar Report. The Profit Radar Report presents complex market analysis (stocks, gold, silver, euro and bonds) in an easy format. Technical analysis, sentiment indicators, seasonal patterns and common sense are all wrapped up into two or more easy-to-read weekly updates. We are accountable for our work, because we track every recommendation (see track record below).
Follow Simon on Twitter @ iSPYETF or sign up for the FREE iSPYETF Newsletter to get actionable ETF trade ideas delivered for free.

|
